The context
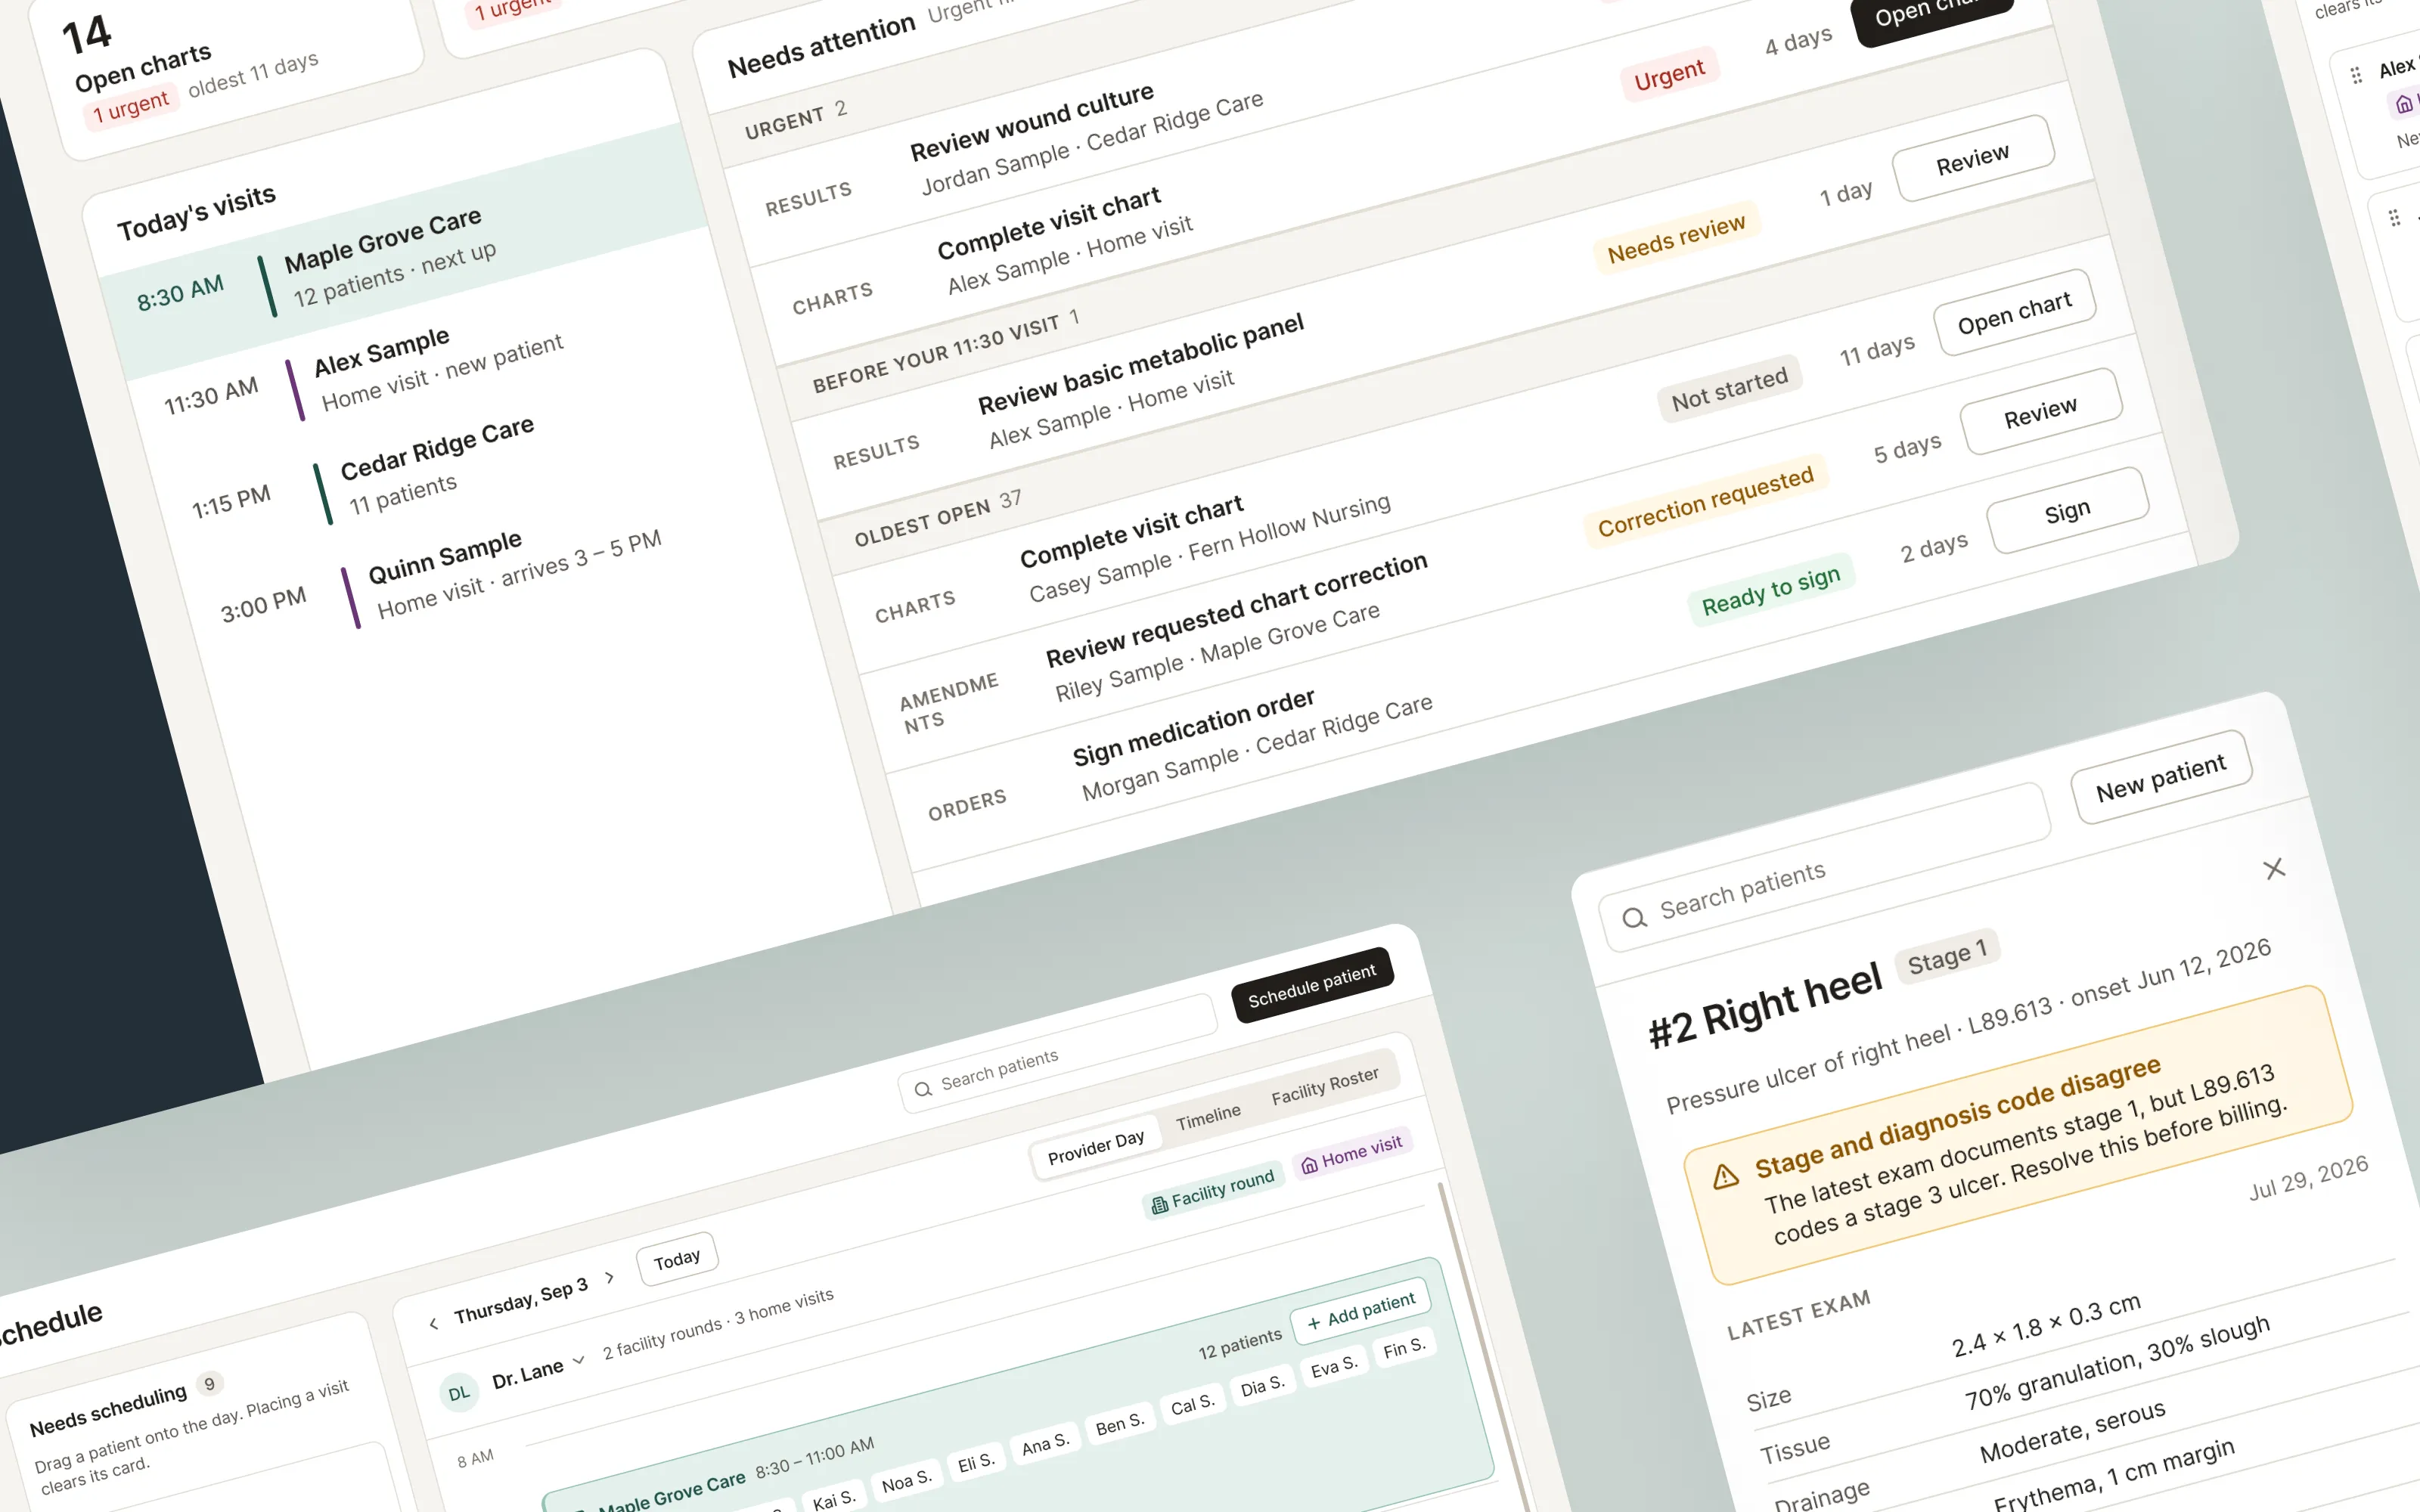
A mobile wound-care service sends its clinicians to long-term care facilities, skilled nursing facilities and patients’ homes. They needed an electronic health record built around that work, covering scheduling rounds across many facilities, charting at the bedside on a tablet, and getting signed charts ready for billing.
I was the only UI/UX designer on the project, working with the product lead and the engineering team. The first version was released as an early test with real clinicians, who used it alongside their existing system instead of switching over on day one. That meant it had to beat their current process right away and keep improving every sprint.
Who it’s for
Seven roles share the product, and each needs something different from it.
- Schedulers turn scheduling requests into placed home visits and facility-round slots.
- Admins set up and edit the recurring facility rounds.
- Providers see the day’s work, chart visits and sign off on them.
- Scribes document alongside the provider during rounds.
- Treatment nurses run their own nurse-led treatment visits.
- Intake specialists onboard patients, collecting demographics, insurance and consents.
- Billers review signed charts, verify coverage and handle amendments.
Constraints that shaped the design
- Manual entry in V1. There was no insurance eligibility feed or claims system yet, so the design could only show what someone had actually entered.
- Tablets come first. The app runs full screen on tablets, so the in-app back arrow is the only way out of a screen. I designed for tablet size from the start, not as an afterthought.
- A healthcare data standard underneath. Every state in the interface had to match a real record and status in FHIR, the standard the product’s data is built on.
- Dashboards had to stay actionable. An early planning decision ruled out charts, trends and KPI tiles on the work dashboards.
- One product, two specialties. A primary-care version had to come from the same product as a display setting, not a separate copy.
How I worked
I followed the same loop on every feature. I listened to users and the client, checked ideas against the requirements and the real code, explored options, built prototypes, and then checked the result in the running product.
- 01
Listen
Three user-testing sessions led to about 33 follow-up tickets. I wrote specs for the unclear ones.
- 02
Align
Checked each design against the requirements and against what the code actually did.
- 03
Explore
Studied comparable products, then compared options side by side in Figma before choosing.
- 04
Prototype
Built working prototypes in code against the real backend, using demo patients.
- 05
Verify
Tested flows end to end and ran design reviews that checked contrast and touch-target sizes.
When a requirement called for a design that would be hard to use, I proposed a better one that still met its goal. For example, one requirement asked for a grid with a column for every provider, which became unreadable past a few people. I proposed a timeline with a row per provider instead, which shows the same information at any team size. I kept a written record of each change like this so product and engineering could approve it.
I used Claude Code, an AI coding tool, to build my designs directly in the product’s code. I directed the work and reviewed every change, and engineers reviewed it before it merged. Working this way helped me catch problems early, like made-up data in mockups or labels covering for missing features, and I turned each catch into a design rule.
Three problems up close
The project was too large to show whole, so here are three problems in more depth. The screens are redrawn for this portfolio with fictional patients, clinicians and facilities. Each keeps the design decisions from the project, and the layouts and visual design are refined in the direction we planned for after V1.
Scheduling around two kinds of visits
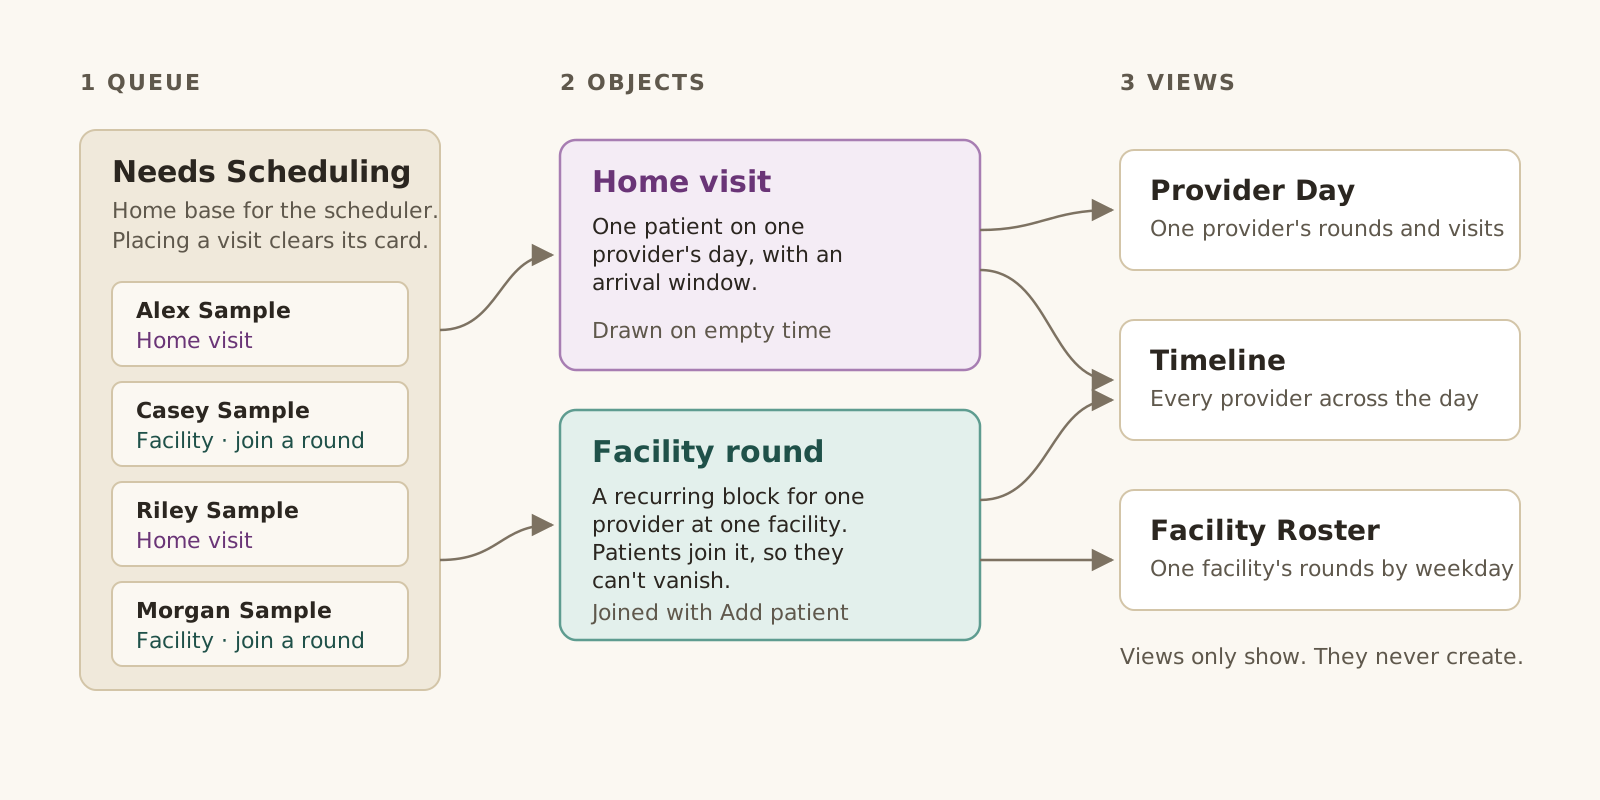
The original calendar pushed two very different things through one grid. A home visit is one patient on one provider’s day. A facility round is a recurring block for one provider at one facility, and patients join it. Treating them as the same thing made appointments seem to disappear and made the all-providers view unusable.
I rebuilt scheduling around the scheduler’s day. A Needs Scheduling queue is home base, and placing a visit clears its card. Home visits are drawn on empty time and carry an arrival window. Rounds hold their patients, so nothing disappears. Three views show the day by provider, across the team, or by facility. They’re only for viewing, so creating a visit always starts from the queue or a round.
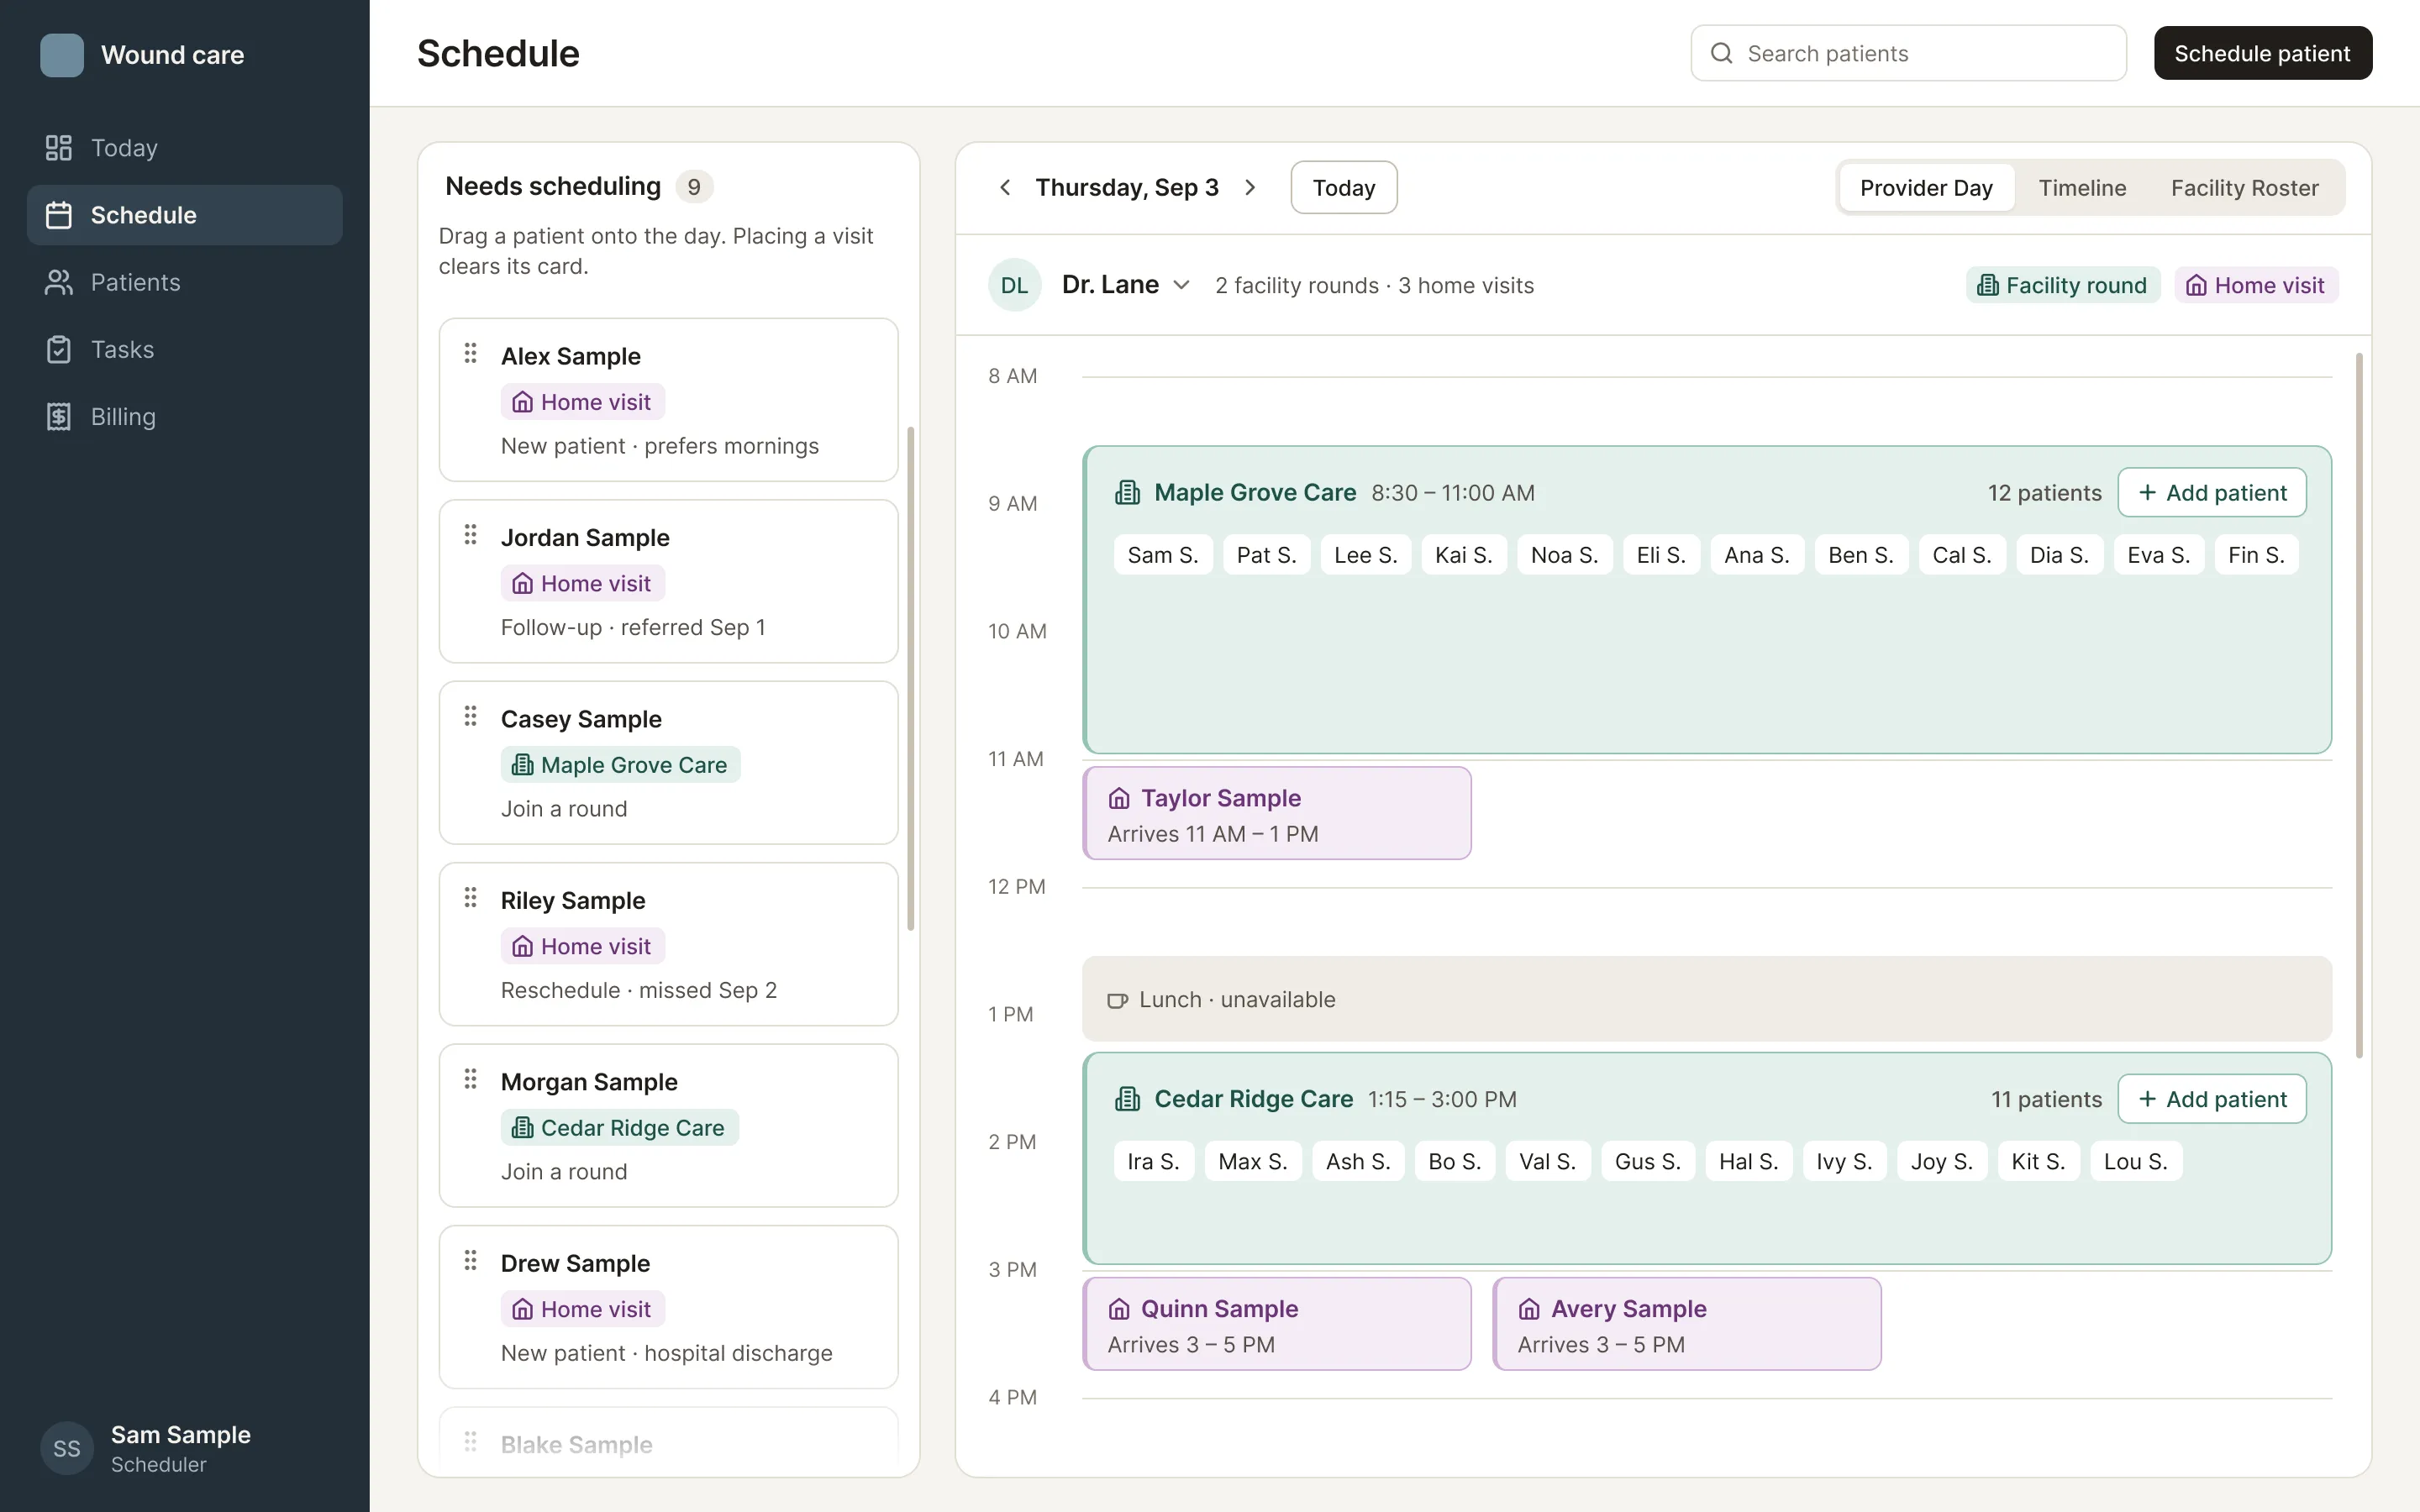
- 01Home baseThe queue lists everyone waiting to be scheduled. Placing a visit retires its card.
- 02Rounds hold their patientsA round is a container, so its patients can’t vanish from the grid.
- 03Arrival windowsHome visits drop into gaps with a patient-facing window, like 11 AM to 1 PM.
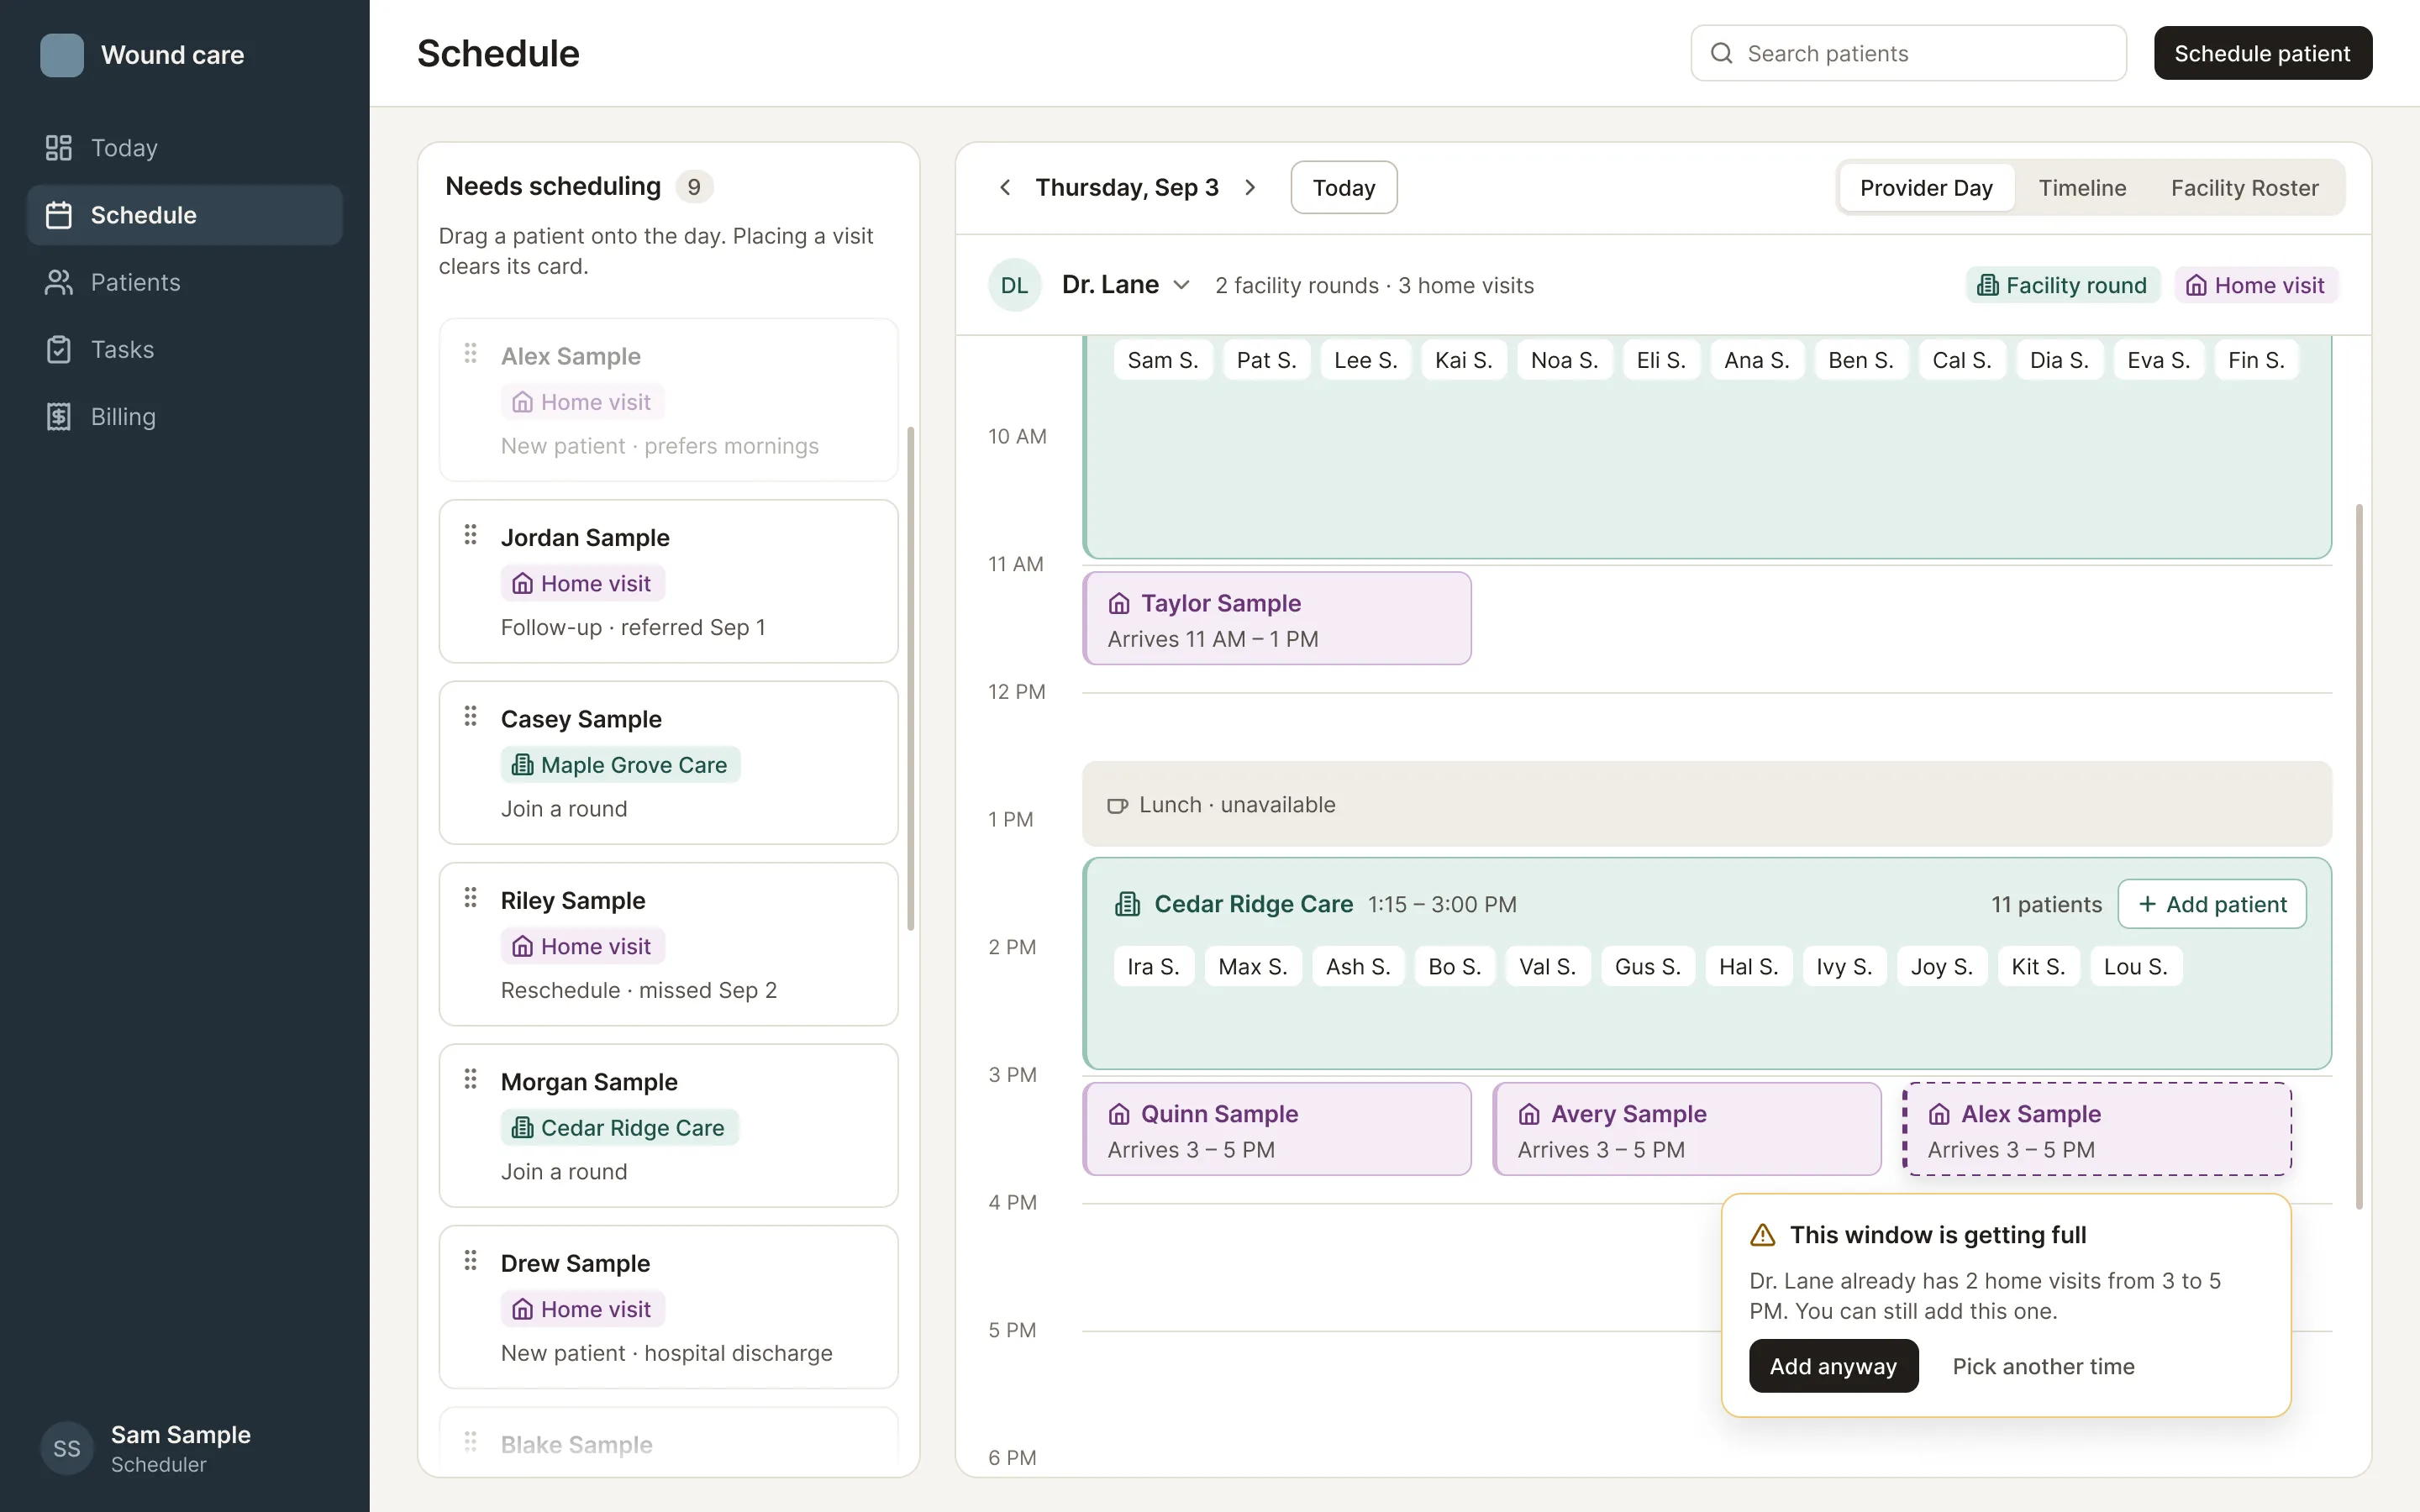
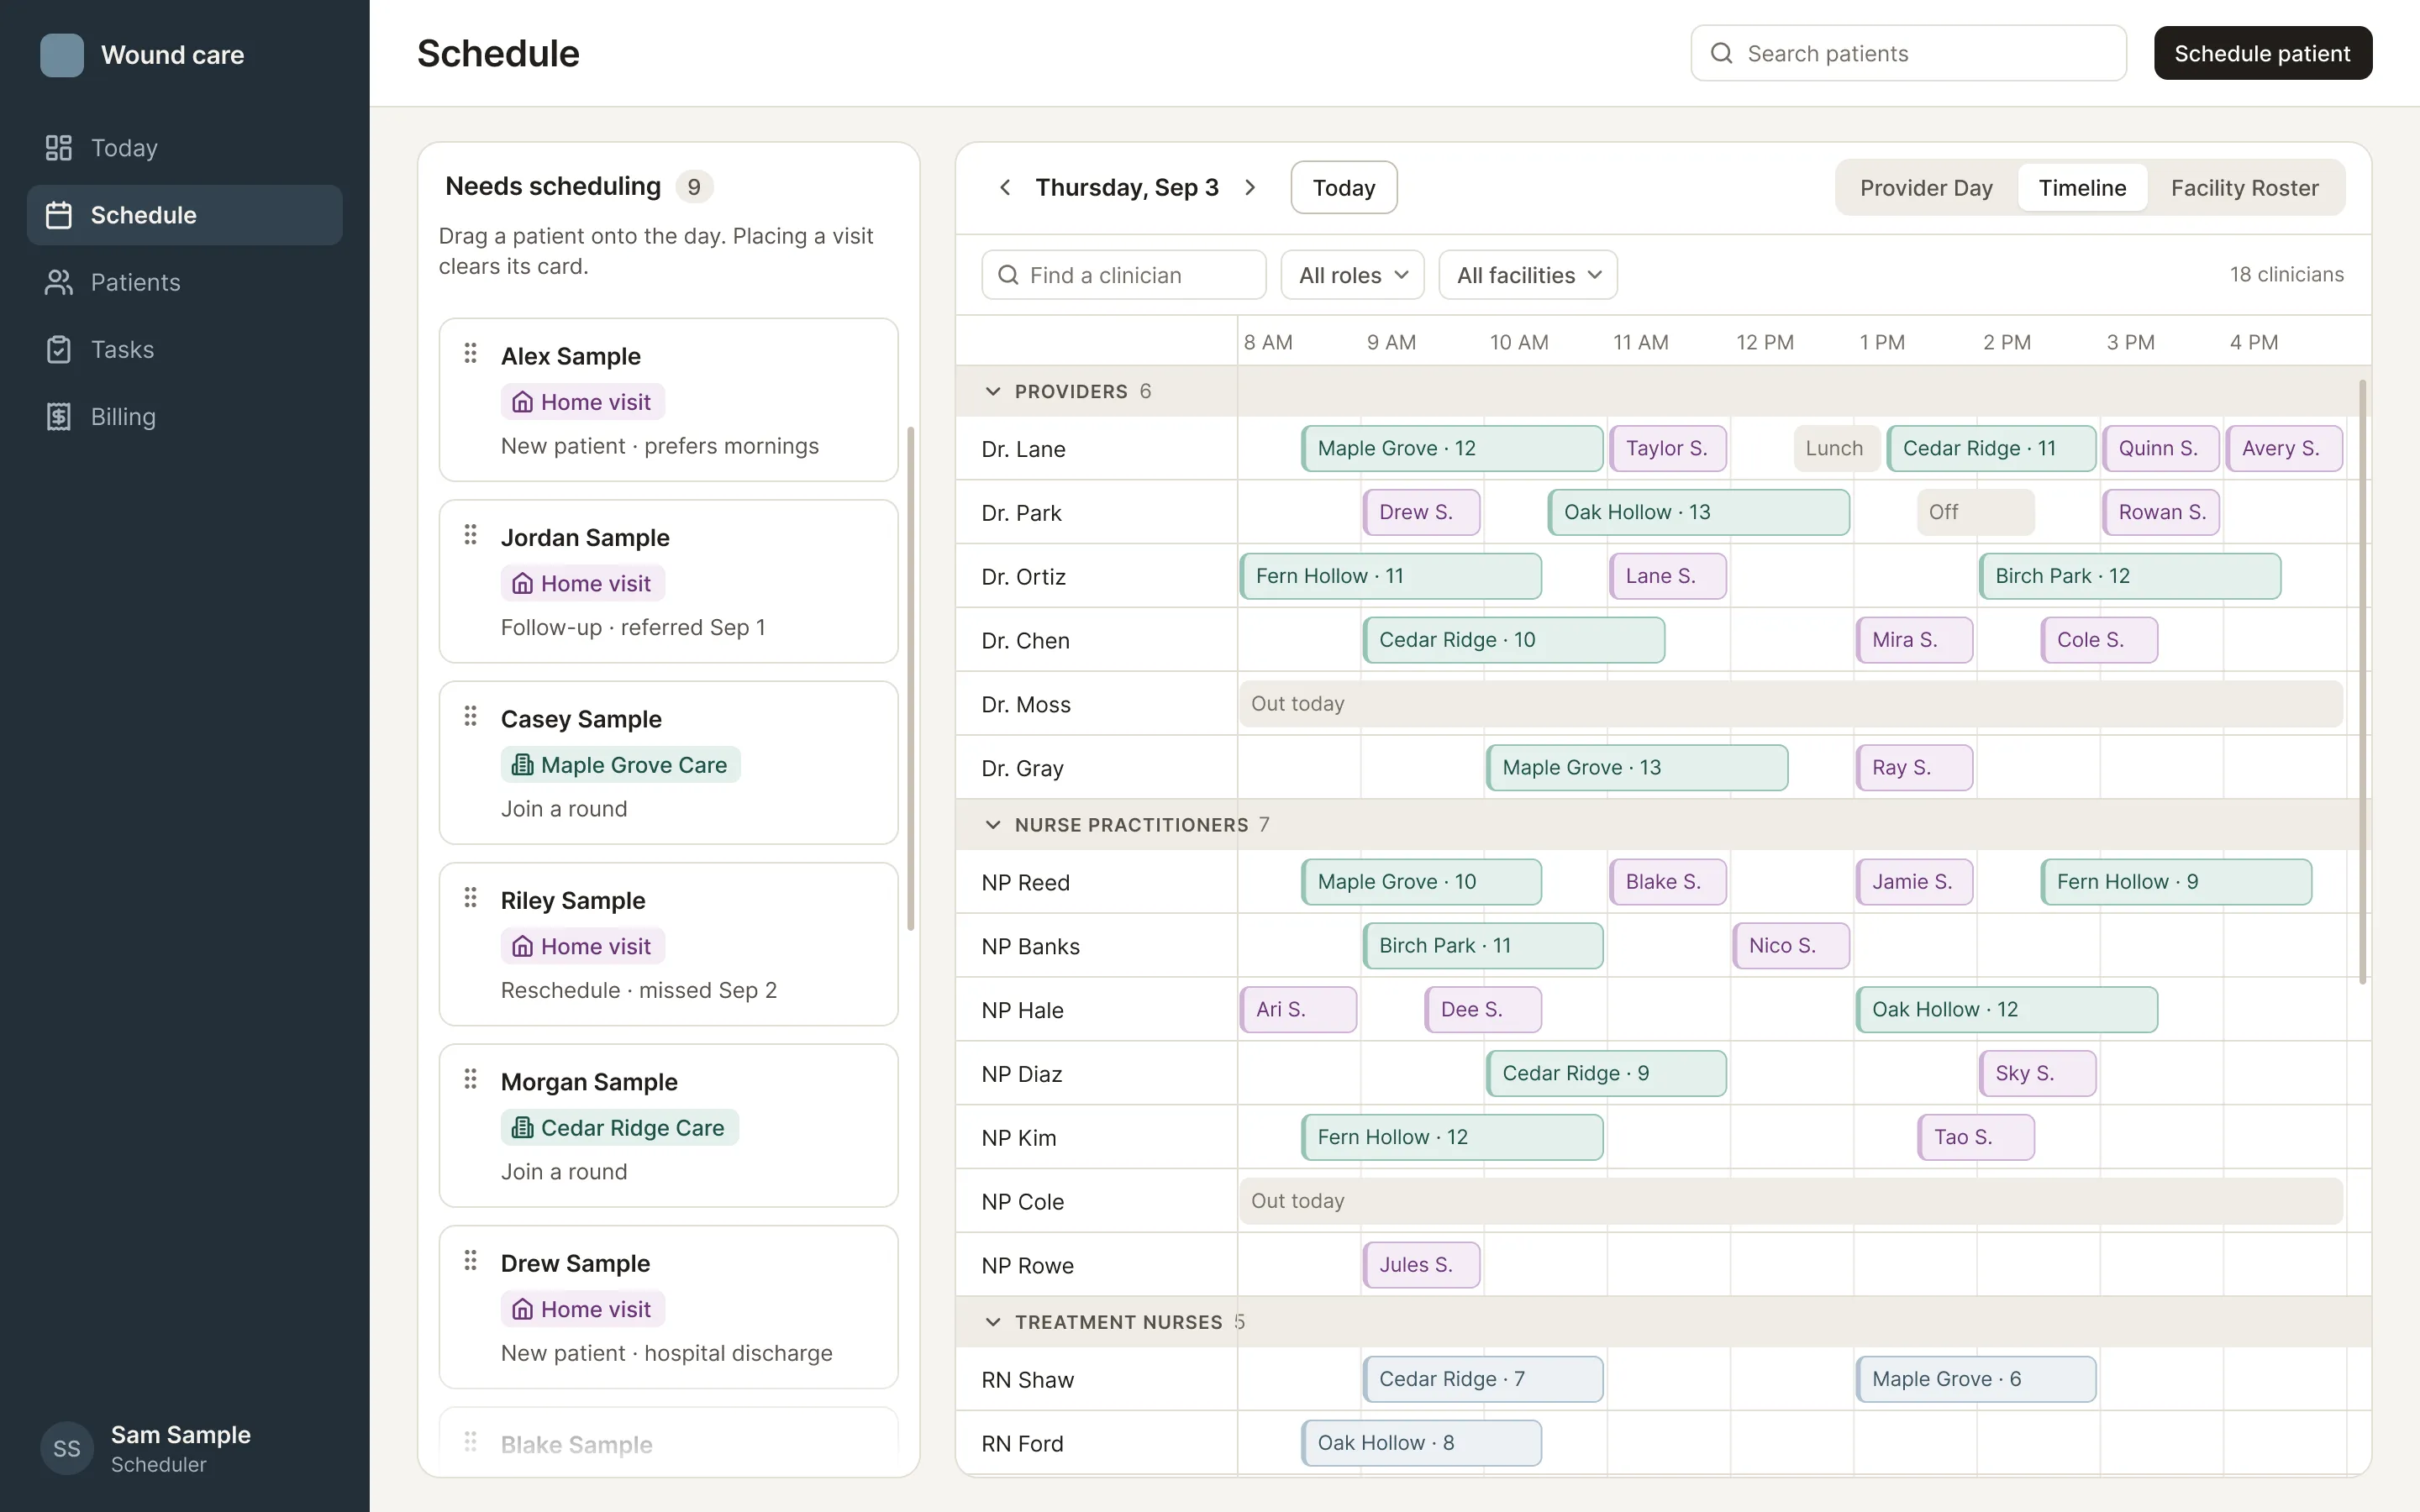
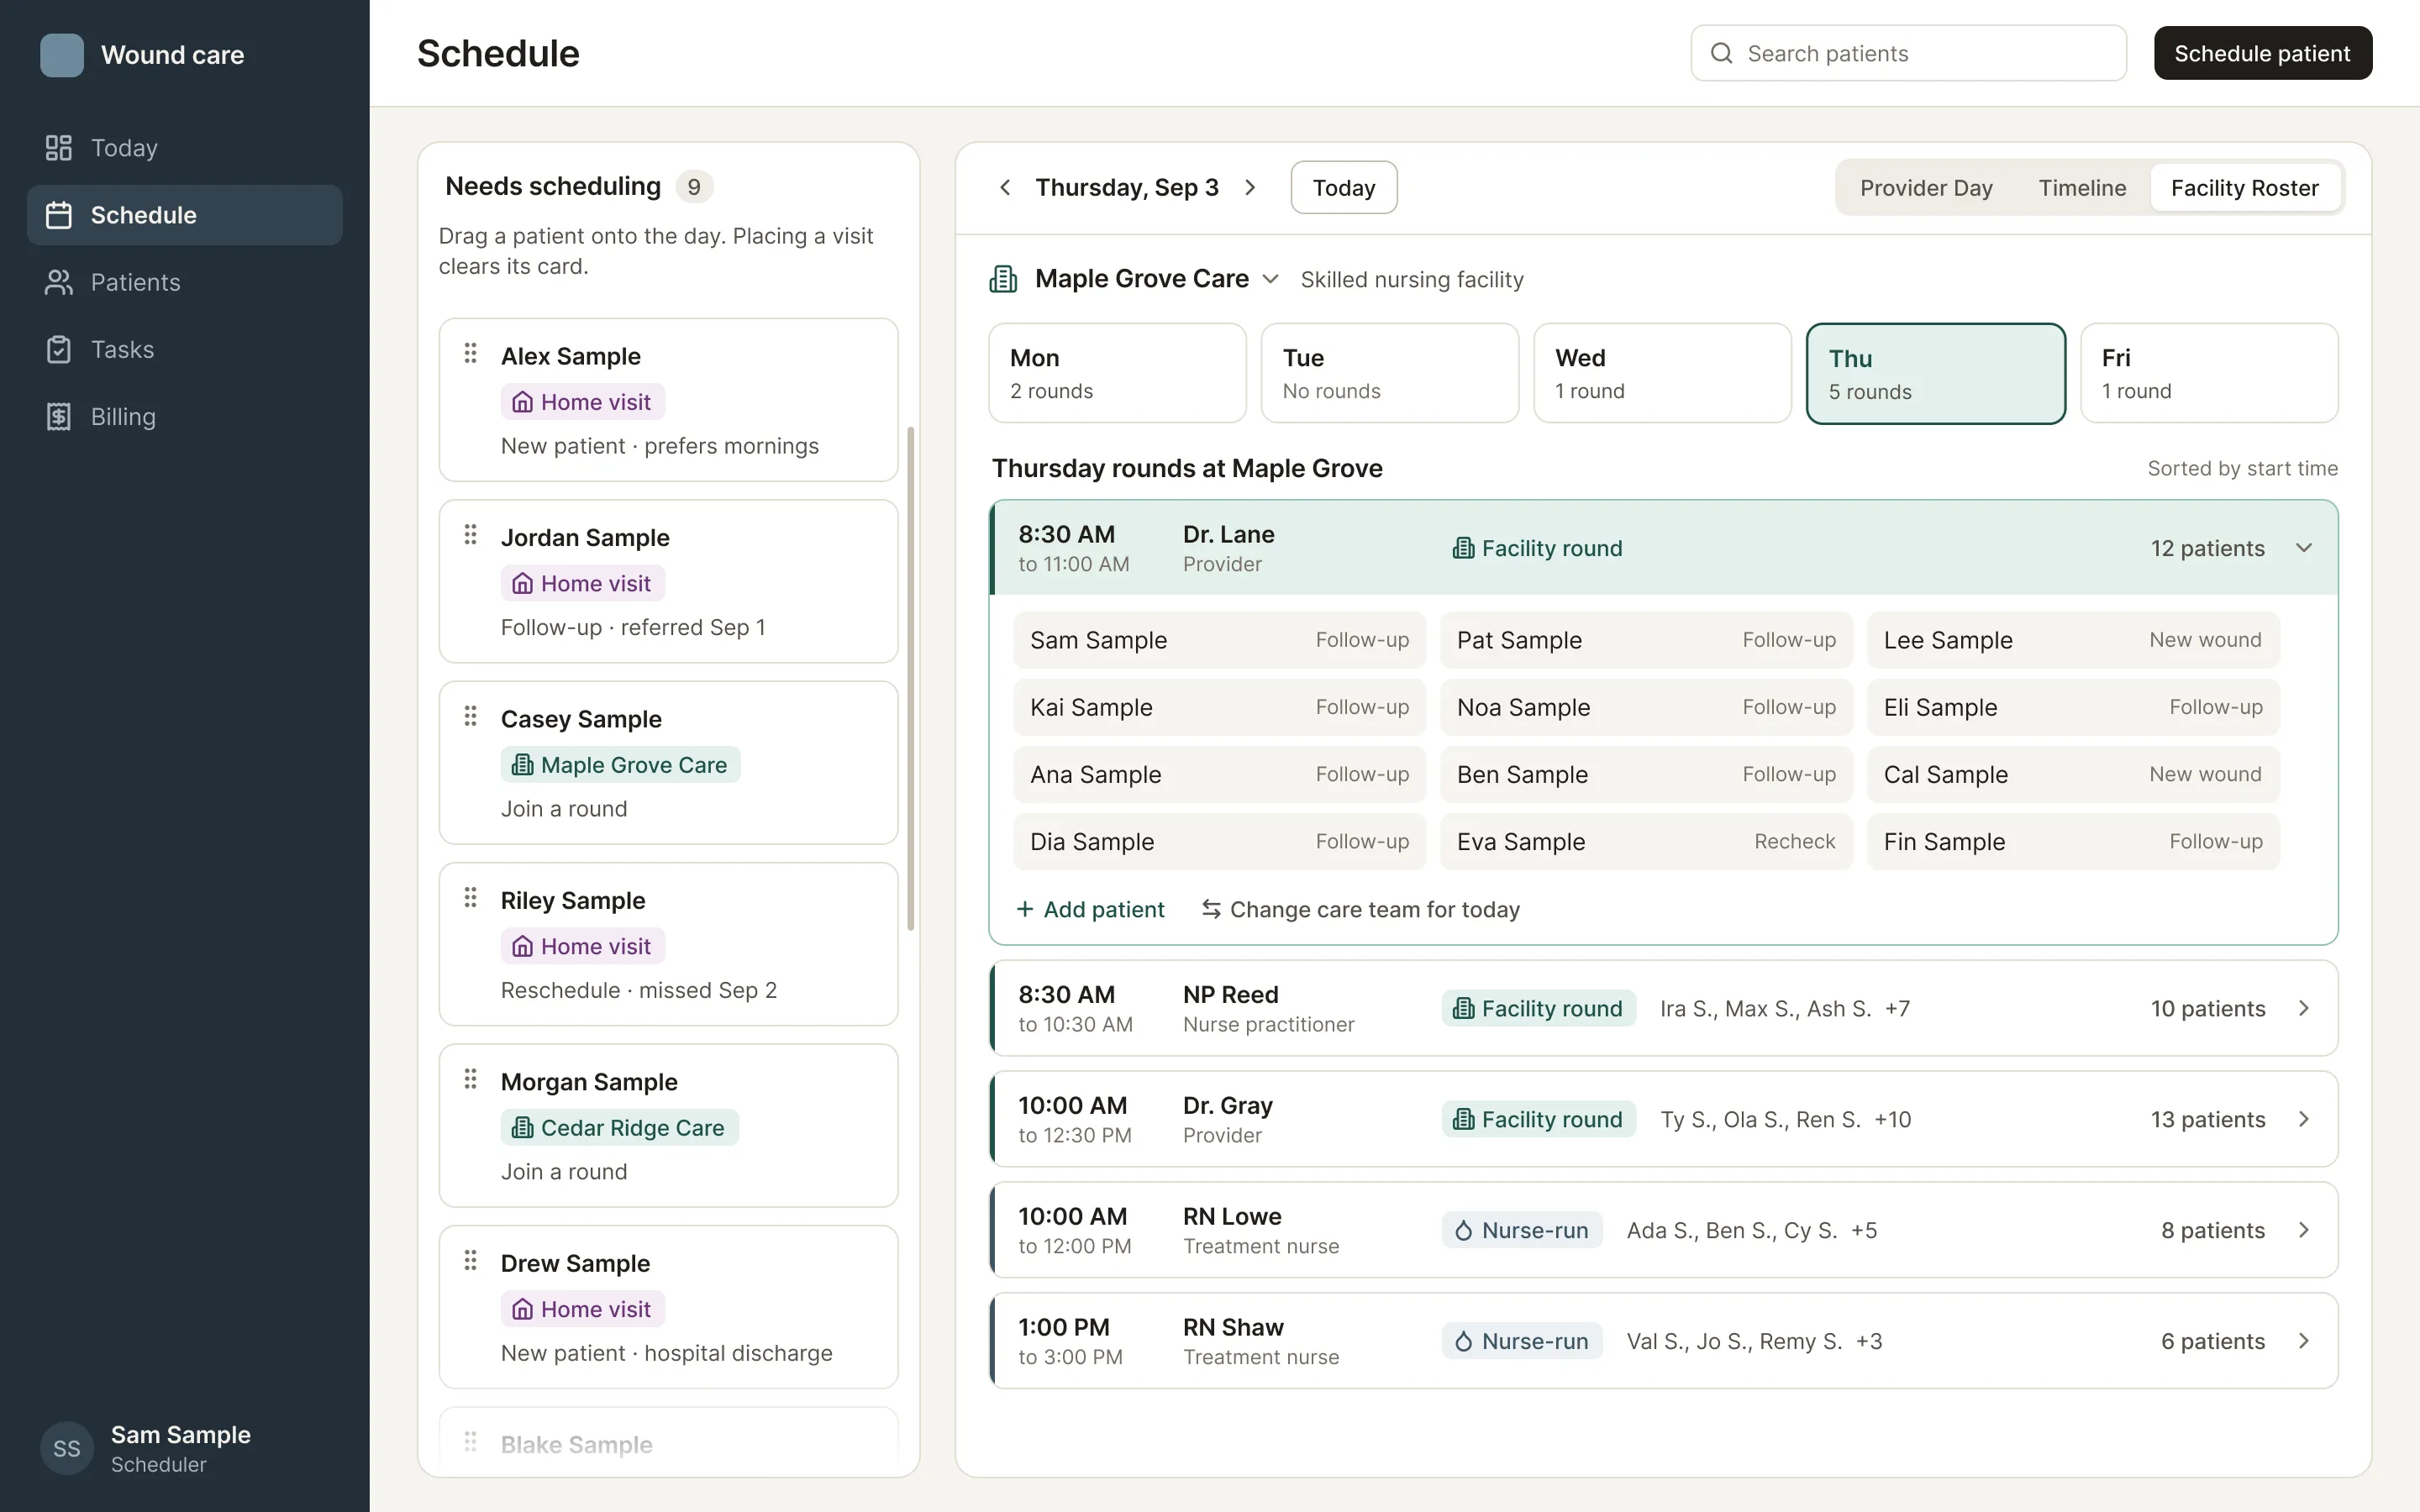
The redesign shipped in July 2026. It raised coverage of the scheduler’s core tasks from 7 of 10 to 9 of 10, and the old calendar was retired.
A sign gate that holds
Pre-charting, which means preparing a chart before the visit, and the live visit were the same state, so nothing stopped someone from signing a chart before the visit happened. I separated the visit into four states, with an explicit Start visit step, and added three checks. Engineering adopted the model in its technical plan and built it.
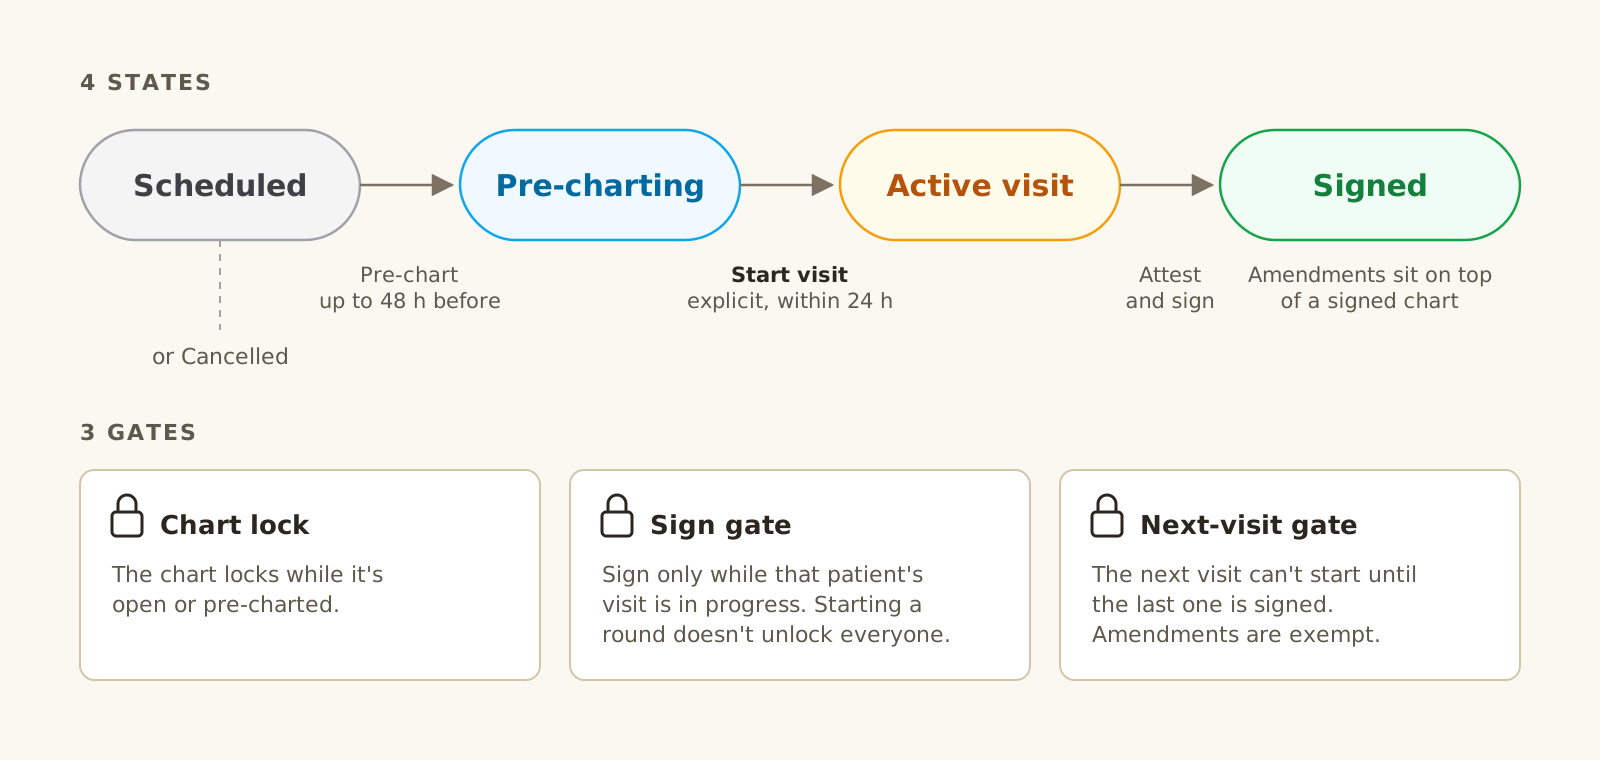
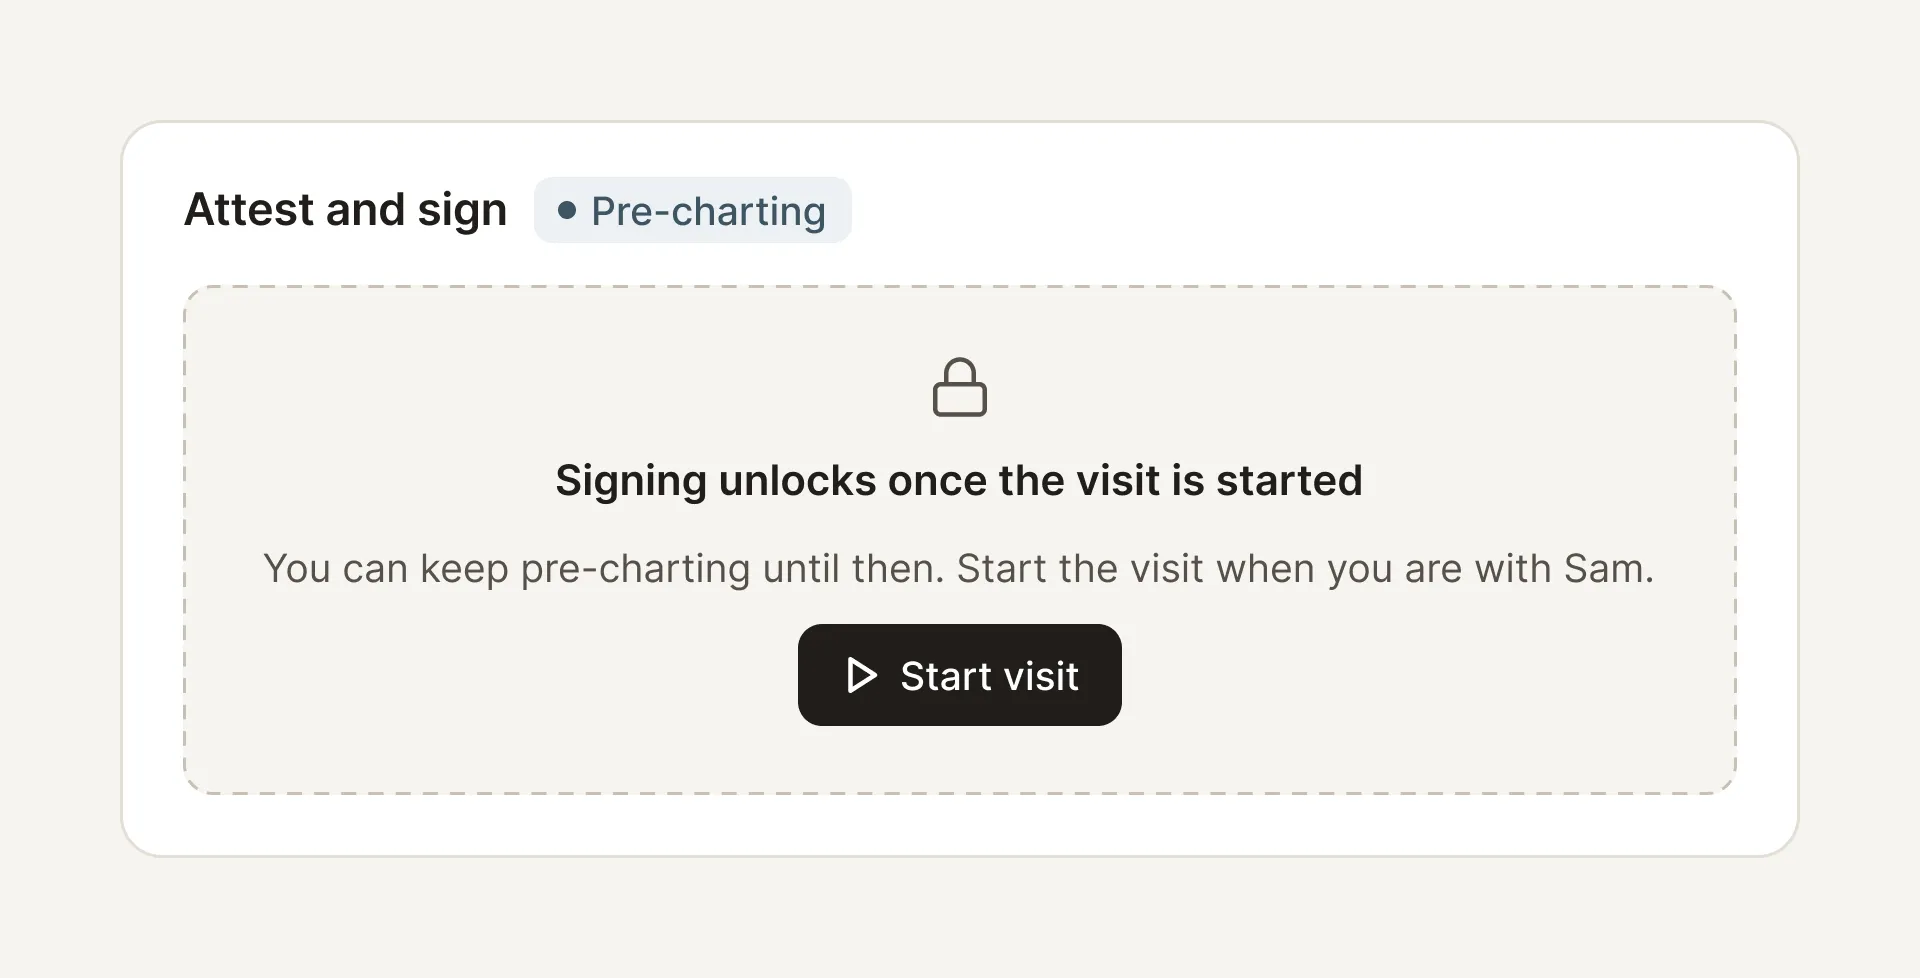
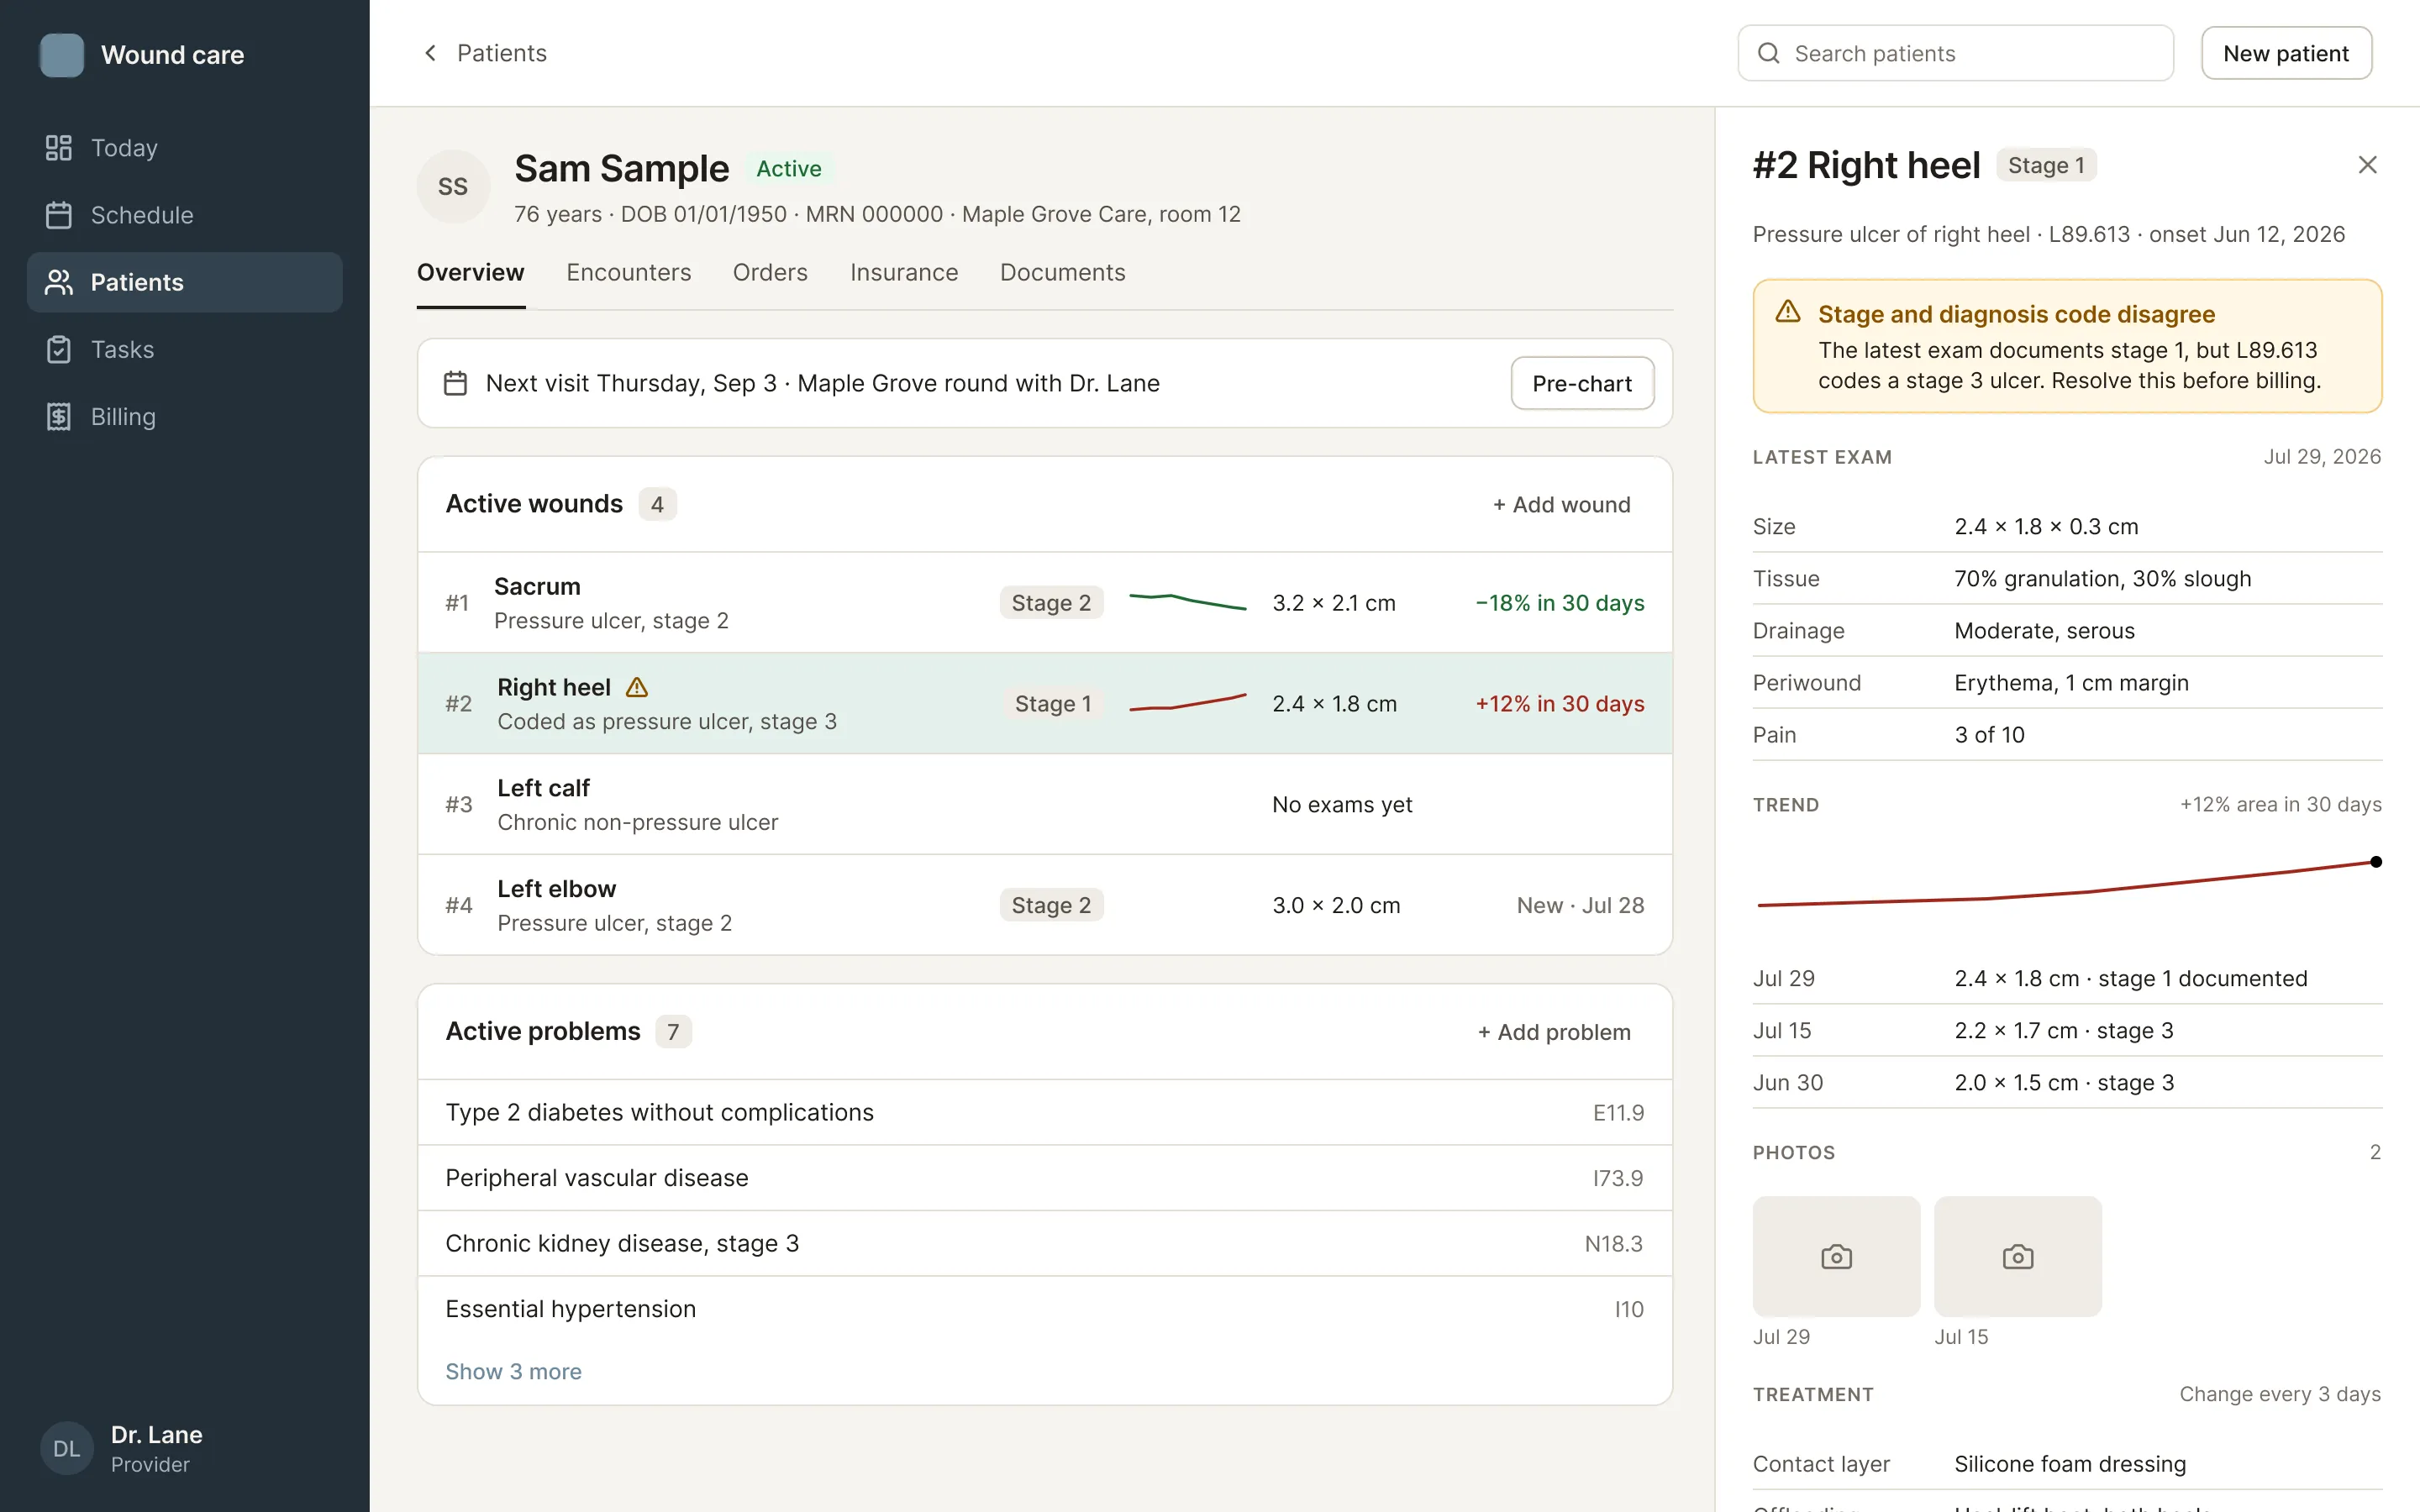
- 01Catch it before billing doesWhen the documented stage and the diagnosis code disagree, the chart says so.
A dashboard for the day’s work, not a report
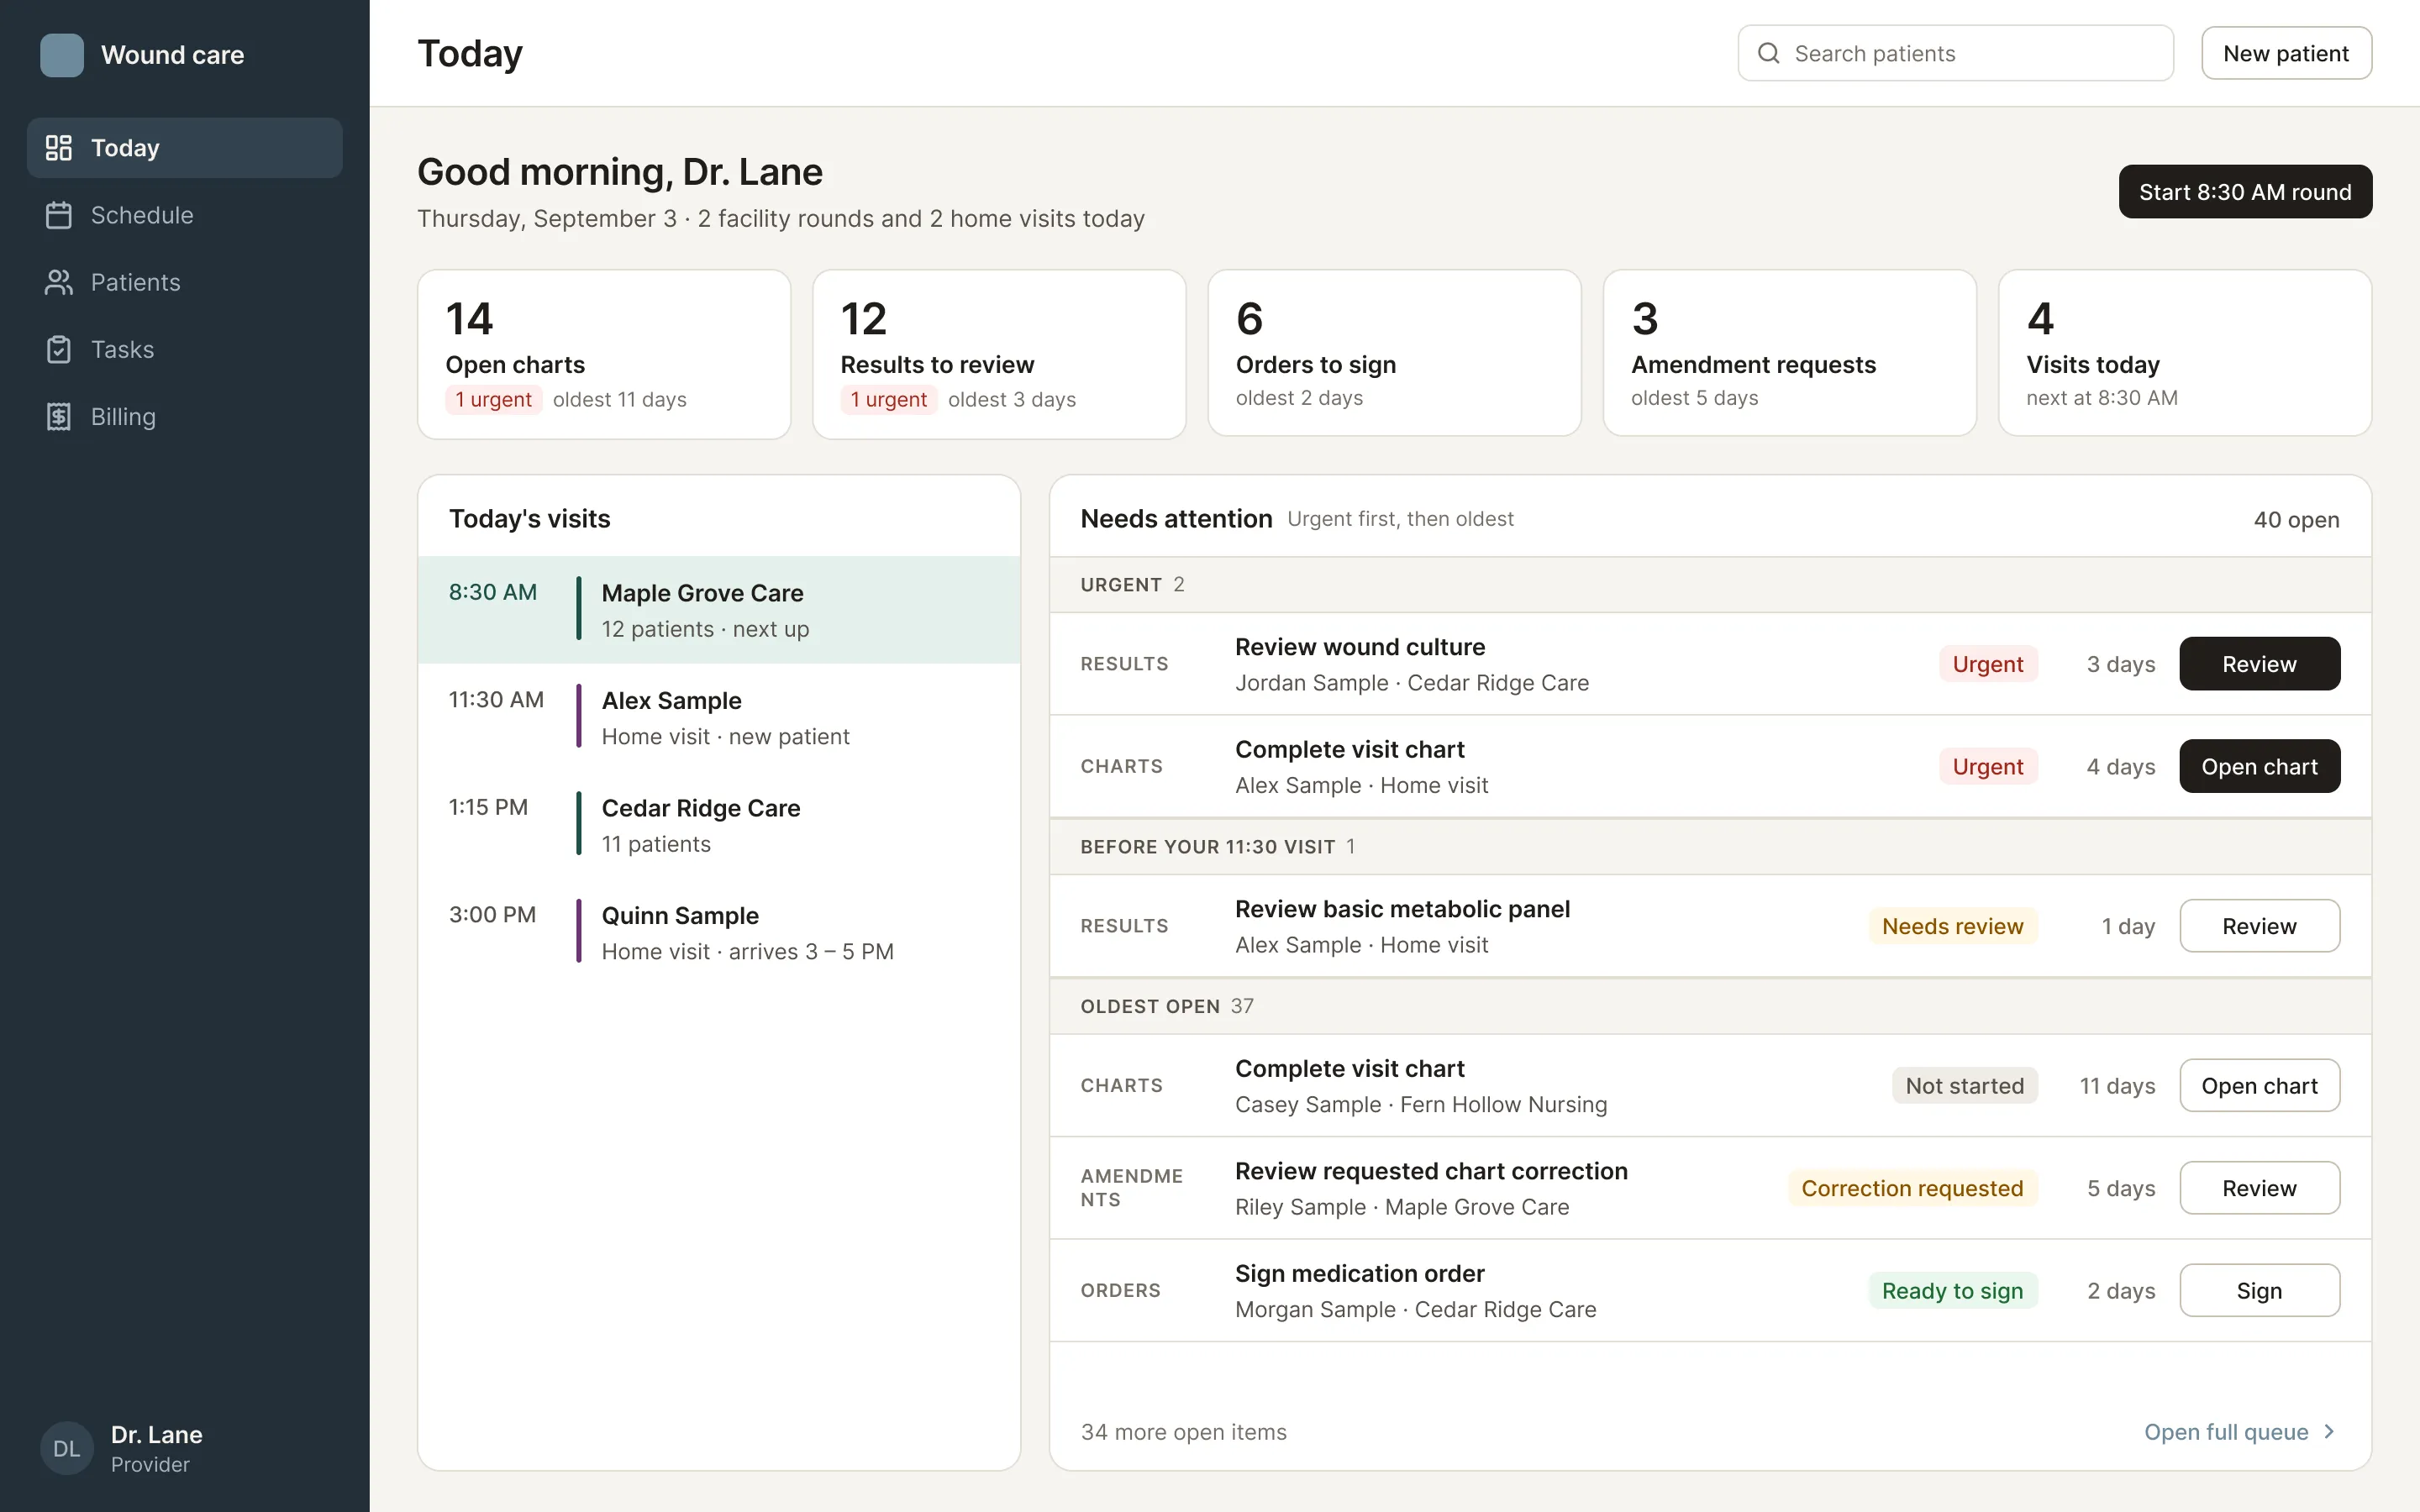
The dashboard is the first screen after login, and an early planning decision ruled out charts and KPI tiles. So I designed it to orient people to their workload. Counters show what’s waiting, and one Needs attention list sorts every task by urgency and then by age. It held up at the real load of ten or more tasks per type.
It could only show what the product actually knew. I removed a made-up red-to-amber urgency scale, because the data only marks tasks as urgent or not, and dropped “overdue,” because tasks have no due date. This design is planned for after V1.
More from this project
Wound documentation
ShippedA redesigned Add Wound flow, a body-map site picker that records left and right correctly, and support for a wound that spans several sites.
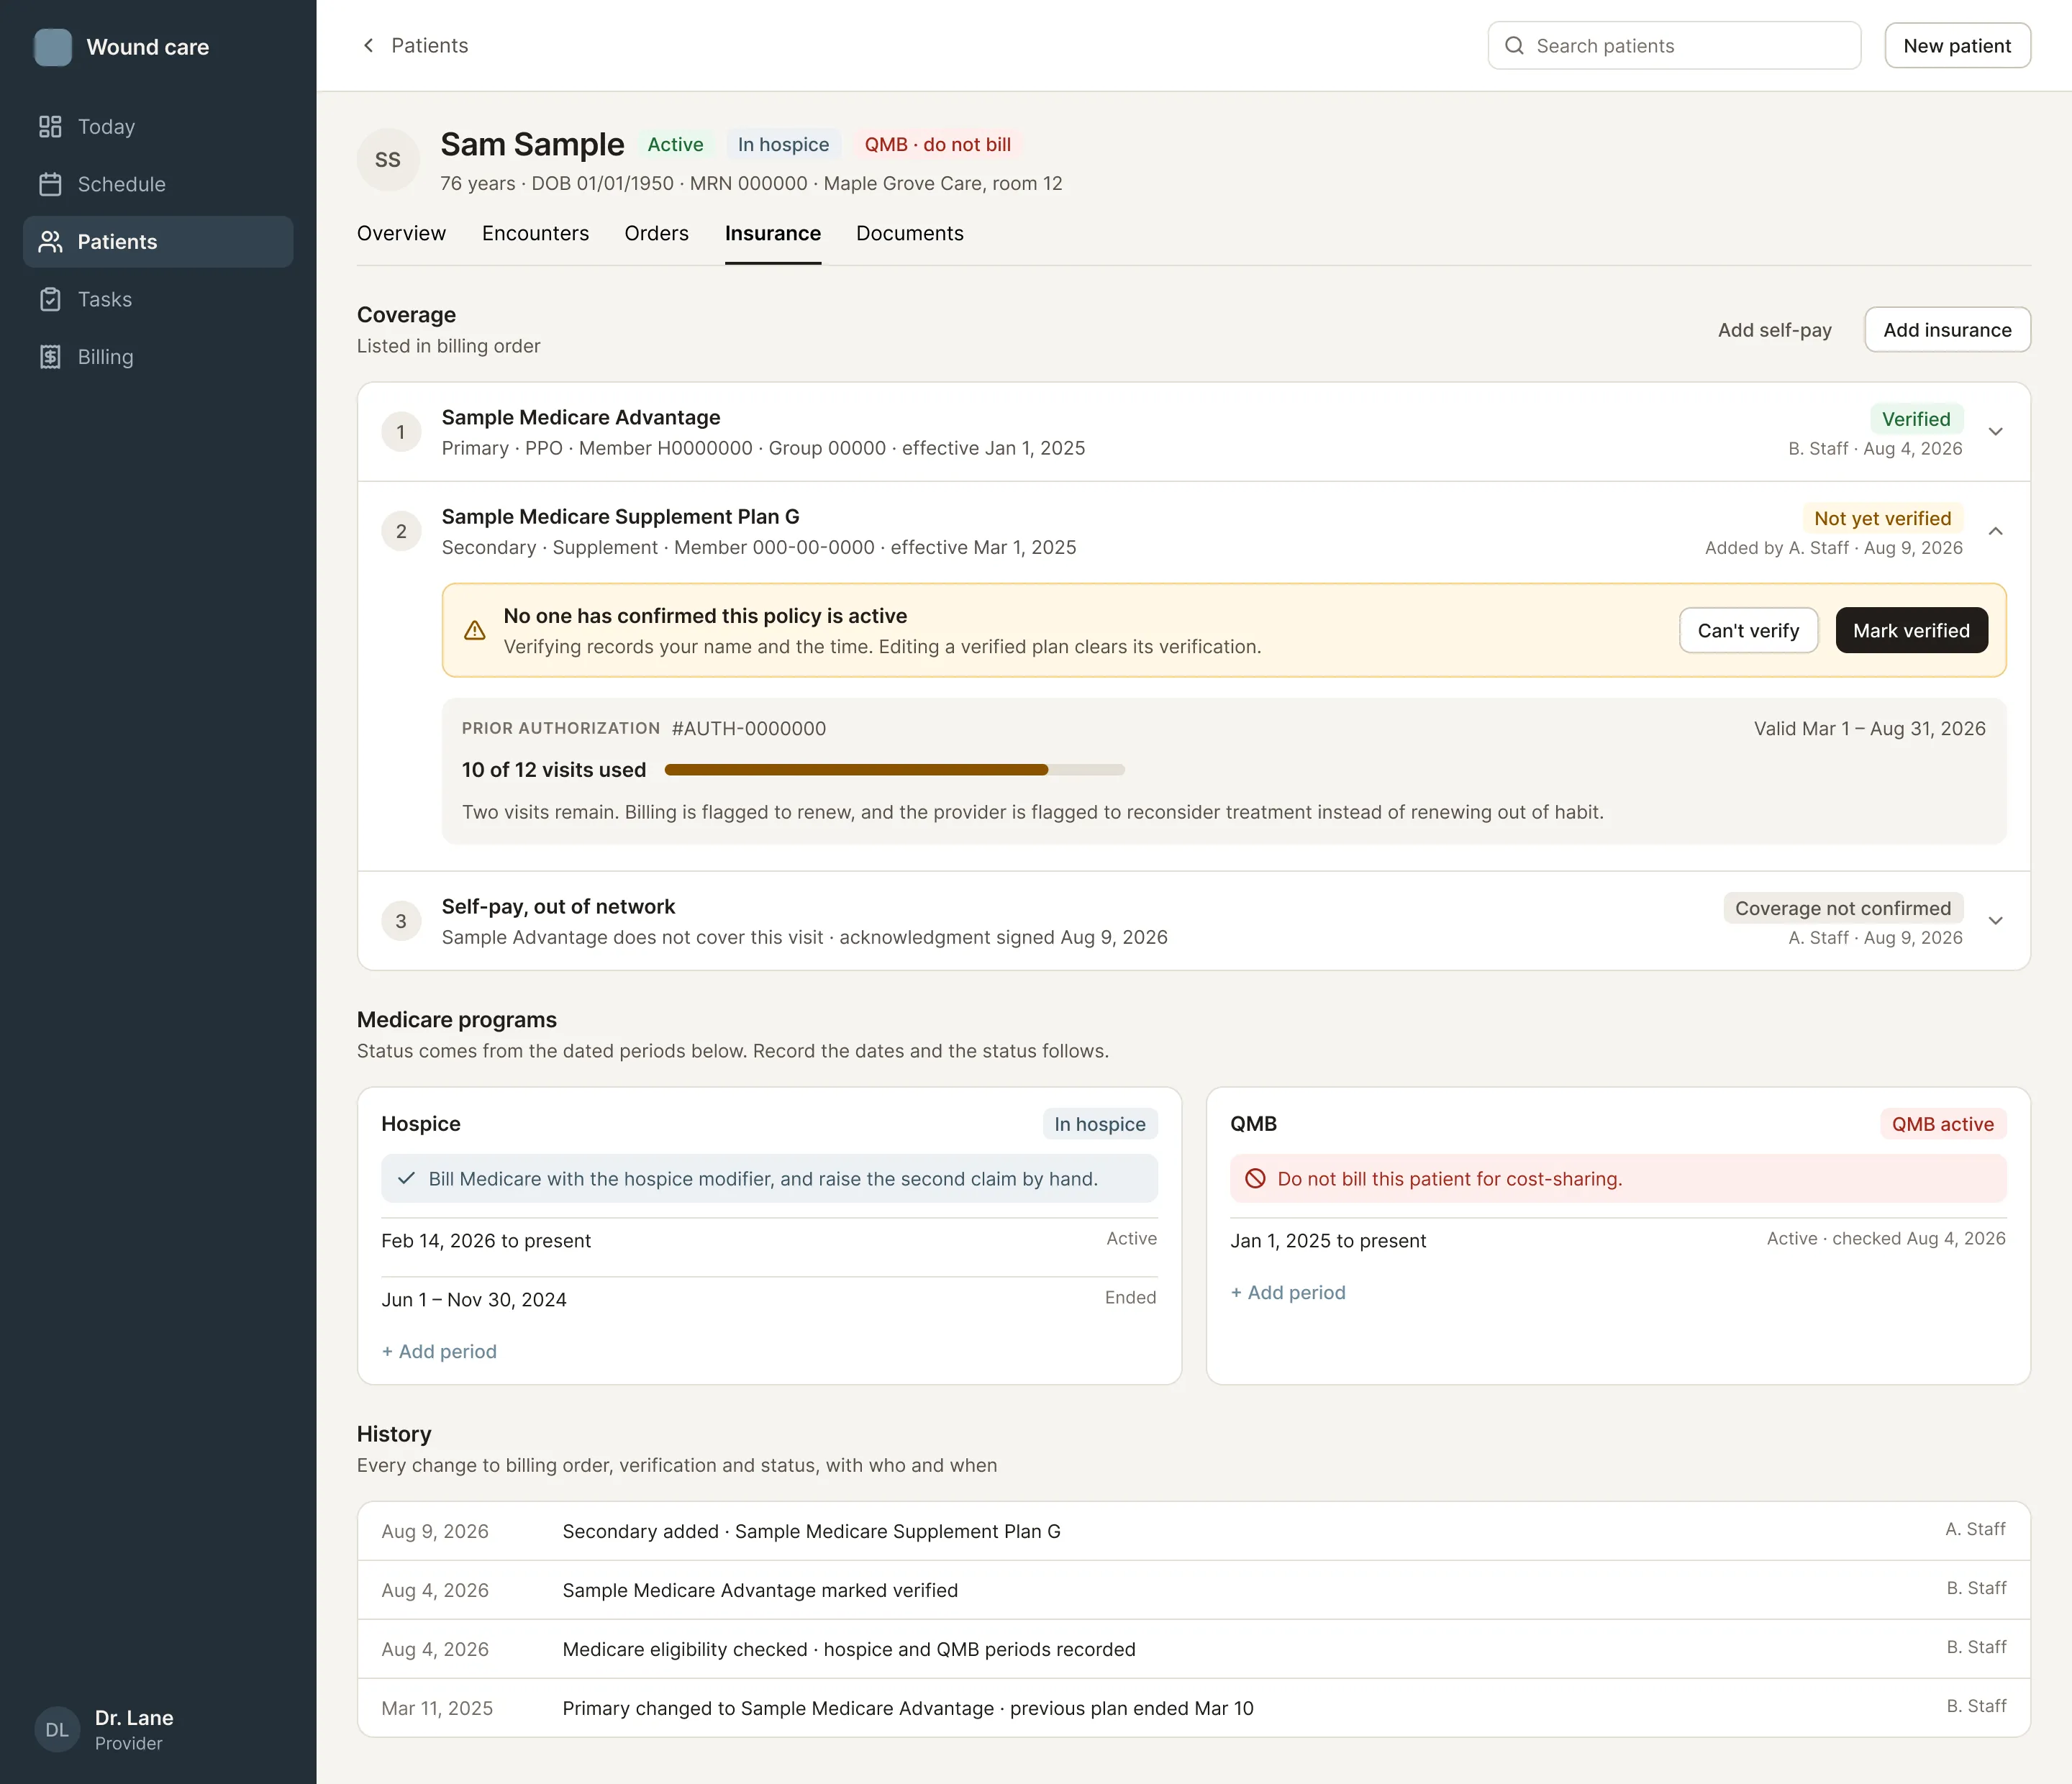
Insurance and billing
ShippedRebuilt the insurance tab as coverage rows with Medicare programs and history, then designed prior authorization, verification, clearance and hospice flows.
Internal notes
ShippedStaff notes on a patient that can’t be edited after posting, only retracted or pinned, and that attach automatically to wherever you write them.
Primary-care mode
DesignedA screen-by-screen mapping for a primary-care version that hides wound features instead of forking the product.
Back navigation
SpecifiedAn audit found six different back behaviors behind one identical arrow. I specified one rule, that back returns you to where you came from.
Printed documents
DesignedLayouts for every document the system prints or faxes, from the scribe sheet to the patient’s after-visit summary.
Principles I applied
Rules I set during the project, each from a specific moment.
Change the form, keep the intent.
When a requirement asks for a design that would be hard to use, I propose a better one that still does what the requirement was for.
Only show what the product can know.
If the system doesn't have the data behind a number or a status, the design shouldn't show it. A screen that promises information the product can't deliver will mislead the people relying on it.
Warn, don't block.
When people have the authority to decide, like whether to overfill a time window, the screen tells them what it knows and lets them make the call.
Suggest, never auto-assign.
Billing and diagnosis codes are suggested, and only a clinician's approval adds one.
Offer navigation, not knowledge.
With no automated data feed in V1, the screen points people to where they record what they've checked, instead of pretending it already knows.
Allocate space by volume.
Thirty results shouldn't get the same room as one order. Layouts follow how much there is, not which category it belongs to.
Outcomes
- 18 changes shipped to the product between June and August 2026, along with specs and design reviews.
- Scheduling shipped. The scheduler-first redesign merged, followed by five more scheduling changes. Coverage of the scheduler’s core tasks went from 7 of 10 to 9 of 10.
- The visit lifecycle was adopted. Engineering took my visit states and sign gate into its technical plan and built them.
- Testing requests became features. Requests from three testing sessions trace directly to shipped work, including the three-tab visit chart, the body-map picker and multi-site wounds.
- Early users responded well. In a testing session in early September, a provider walking through the app compared it favorably with the system they use now.
Next, I’d measure how long it takes to chart a facility round, how many charts are signed on time, how often billing sends a chart back and why, and how long requests wait in the scheduling queue.
Reflection
Early on, I proposed a single button that would sign a provider’s update and close a review task in one click. The product lead pointed out it only worked if that visit was the only thing the provider did. Since then I test every flow with “what happens when” before proposing it. That habit later caught a real dead end on the hospice reporting page, where a provider who disagreed with a report had no way to say so.
I’d also ship design changes in smaller slices. A large visual update lived on its own branch while engineering changed the same screens. When I merged, I chose engineering’s versions to keep the product consistent, and some of my work was dropped.
Two next steps for the product came from a provider in that September session. One is designing for onboarding a whole new facility at once, which stretches the pre-charting window. The other is finer body-map precision around the lower back.